Price formation Rectangle
After a previous strong trend, a formation is sometimes created, where the market moves for some time in a horizontal direction and forms a rectangle formation. Thus, the formation is formed by two parallel horizontal lines that form support and resistance. So, to create a rectangle, you need at least two highs at a similar level and two lows again at a similar level.
How to trade this formation:
This formation may take several weeks to create, but also several months or even years. Ideally, this formation is created over 3 months. It is true that the longer a formation has formed, the stronger will be the breakthrough one of the levels. When either support or resistance breaks through, it often happens that the price goes back to the line it broke through to test it again. There is a principle that if the price breaks through support, this line becomes a new resistance. If the price breaks through resistance, this line becomes new support.
The formation is usually traded by waiting for one line to break through and enter the trade when the price returns to that line. The target price should correspond to the height of the rectangle from the point where the puncture occurred.
Traders sometimes trade this formation so that they enter short at the resistance level and enter long at the support level. This is repeated until the breakout of one of the lines occurs. In this context, it is important to realize that there is a balance within the rectangle, i.e. neither bulls nor bears prevail. From this point of view, this is an unclear situation, so it is appropriate to close such trades quite quickly.
An example of a rectangular formation is shown in Figure 3:
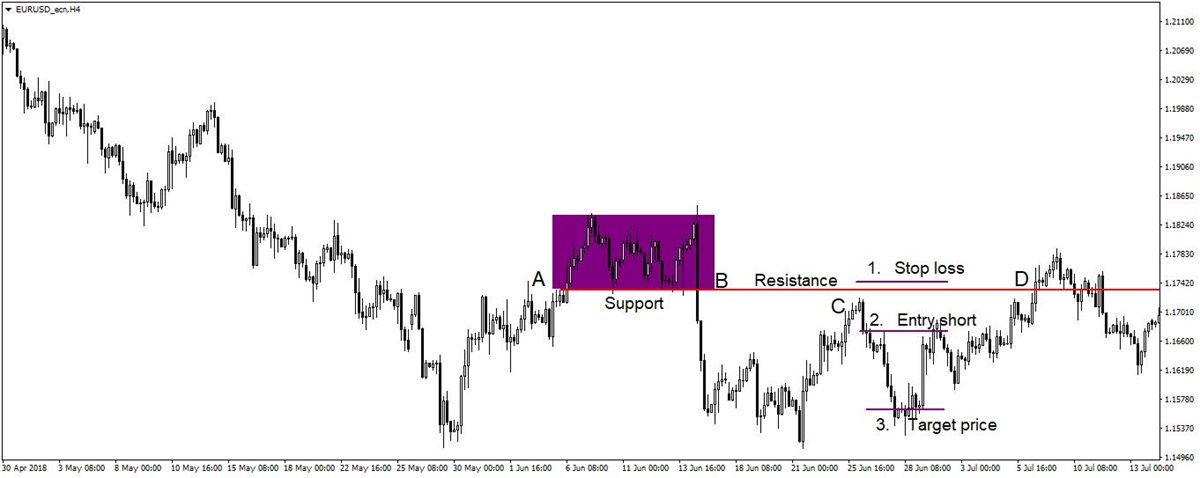
Figure 3: Rectangular formation in a downtrend
Chart breakdown:
The figure shows a part of the previous downtrend on the EURUSD currency pair. A rectangle formation was formed between points A and B. The bottom line was broken at point B, so previous support is now a new resistance. The price approached this resistance at point C, where the entry short could have been taken with a target price that corresponds to a rectangle height and a stop loss above resistance.
If we follow the above rules, we would make a profit in this case. However, if we had wanted more than the recommended profit, we would have been unlucky because, as we can see, the price later returned to point D to retest the new resistance and our transaction would have ended up in a stop loss. It is always important to realize that no one knows where the price will move. Therefore, it is always necessary to follow basic rules, set realistic goals, and not be greedy.