67.90 % of retail investors lose their capital when trading CFDs with this provider.
CFDs are complex instruments and come with a high risk of losing money rapidly due to leverage. 67.90 % of retail investors lose their capital when trading CFDs with this provider. You should consider whether you understand how CFDs work and whether you can afford to take the high risk of losing your money.

Introduction to Price action I: What you need to know before you start

Published: 23.02.2023

This year's markets will favor active traders and speculators. That's why we are starting a short series of articles on price action that will teach you the practical aspects of trading. Moreover, the techniques you learn here can be transferred to any other type of market. In the first part of this series, we will explain the basic concepts of price action trading.


What is price action?

Price action is one way to analyze and read the market movements of various instruments. The method is applicable to all markets and it is one of the most widely used methods. From a perspective of a forex trader, price action means trading purely according to a price chart without technical indicators. After all, technical indicators are derived from the price, so it is certainly worthwhile to learn to read the market based on pure price movements.

When using price action, traders study historical prices and try to identify the necessary signals from the chart.It is necessary to realize that the price action shows the flow of orders on the market. So based on the price action, the trader studies what other traders did, and identifies where the order flow is going. If the trader identifies a significant impulsive movement, he will try to trade in that direction.

Retest rule


The price action traders use the principle that is based on the second test of the level at which the price turned in the past. When such a level is identified, the trader then waits for the price to come back to that level, the price will perform the so-called retest of the level, and the trader takes a trade only after it is clear how the price responded to that level.


Why choose price action trading?

One of the benefits of the price action is that it works very well on higher time frames used by large banks that have enough capital to move the market where they want. Retail traders do not have such possibilities, but they can use price action on higher timeframes to identify what these market players did in the past and what they will probably do again.Another advantage is that by using the price action it is possible to identify different patterns that are repeated in the markets with a certain probability.

Once you learn how to read these market patterns, you will clearly know what you are looking for in the market and therefore it will be easier for you to determine the parameters of the trade. An example of such a pattern is a trendwhere higher highs and higher lows alternate regularly in the case of an uptrend or lower high and lower lows in the case of a downtrend.

A disadvantage of the price action is that there are several different patterns in the market, and each trader can see something else in the chart. Where one trader sees a continuing downtrend, another may see a potential to reverse that trend. Learning to readthe charts objectively is a skill that is not easy. To master it, hundreds of hours of hard work will be required.

What price action trading helps us track?


While using the price action method in trading, we have to focus on several things:

  • Trends
  • Support and resistance levels
  • Price response on support and resistance levels.
  • Candlestick formations
  • Price patterns or formations


The crucial thing in the market in relation to price action trading is the market's context or structure. When trading with the price action, you need to look at the market in certain contexts that provide us with comprehensive information. The market structure is not determined by one or two candlesticks, but it requires a much broader view of the market.

In addition, we will alsobe interested in the length of the candlesticks, whether the candlesticks are close to their highs or lows, whether one color of candlesticks predominates, how fast they reach a certain level, etc. Based on this, we can then identify impulsive movements and corrections.

Impulsive movement can be characterized as a movement where long candlesticks are present, candlesticks close near to their highs or lows, and one color of candlesticks predominates within this impulsive movement. Impulsive movements are often very fast. Trading against impulsive movements is very risky.Two examples of bearish impulsive movements are shown in Figure 1. In the highlighted area, you can see long black candles closing near their lows


Graf č.1: Ukázka impulzivních pohybů v rámci price action
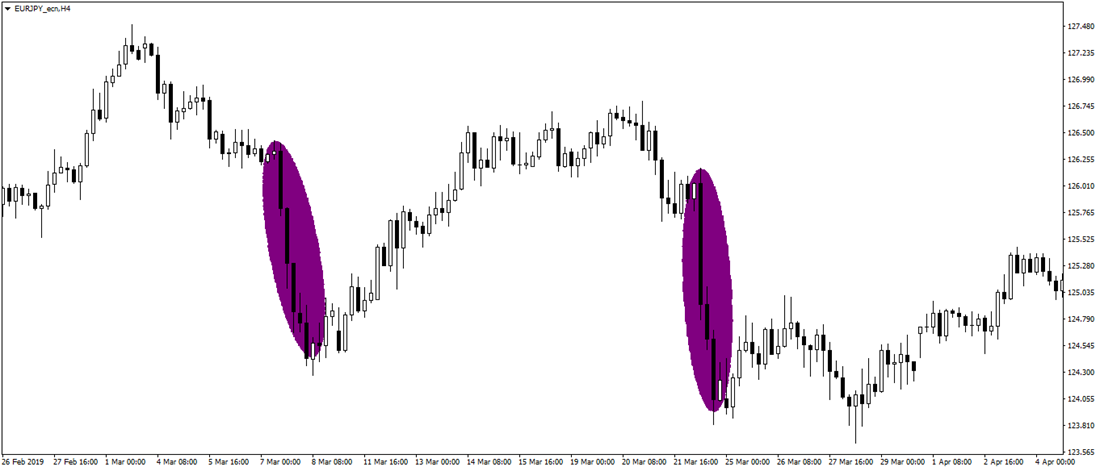
Impulsive movements in price action trading

On the other hand, the corrective movement is a movement where the candlesticks are usually shorter and they often alternate. The movement also takes a longer time. The corrective movement follows the impulsive movement and is usually directed against it.The corrective movement is used for timing the trade in the direction of the previous impulsive movement.

Trends

The trend is rising or falling. We know from a chapter about the trends that the upward trend is characterized by a series of higher highs and higher lows, while the downward trend is characterized by lower lows, followed by lower highs. Trends are volatile or non-volatile. If we identify a trend, the principle is to always trade in the direction of the trend, which is more likely to succeed than trading against the trend.
 

Graf č.2:  Příklad klesajícího trendu
Example of a downtrend in price action trading


Figure shows what a typical price action chart looks like. Only the price without indicators is displayed. There are marked places on the chart where there was a significant change of direction for easier orientation. In this case, the price is moving in a downtrend based on a series of lower lows and lower highs.

Supports and Resistances

Supports and resistances (or resistances) are other important elements of the price action method. These are areas where the price of an instrument tends to stop and turn. If the price comes close to the area of support, it is the level where buyers enter the game and they do not allow theprice to go below this level. If, on the other hand, the price approaches the resistance level, the sellers step in and do not allow the price to move higher.

In our example of a downward trend, we could identify some resistances and supports, see figure:
 

Graf č. 3: Identifikace supportu a rezistence
Identifying Support and Resistance


From the above picture, we can notice one thing, namely if a support gets broken it becomes a new resistance, and the same is also true in the opposite direction when broken resistance becomes a new support.

Reaction to support and resistance levels

Another important element of the price action is identifying a response that has occurred on support and resistance levels. Only after that, it is more clear what direction the price is going to move and the trader may take a trade if the trading idea is in line with the market context. Thus, if the market is moving in a downtrend, the trader should only take short trades, if the market is in an uptrend, only long trades should be taken.

These reactions can be identified by candlestick formations. We will talk about them in the next chapters. If the reaction on support and resistance level moves against the market context, the context is negated and the trader should not trade in such a situation.

Key terms

Candlestick patterns
Show answer
Candlestick patterns consist of one or more candles. Most candlestick formations consist of a maximum of five candles. They are used for short-term predictions of price movements or serve as confirmation for trade entry.
Forex
Show answer
Forex is a global market on which currency pairs are traded. The name Forex is derived from Foreign Exchange. The Forex market is the largest and therefore one of the most liquid markets in the world.
Price action
Show answer
Price action is a method of technical analysis that is based on observing a price chart without any indicators. It uses candle and price formations, market structure, horizontal supports and resistances and possibly trend lines.
Resistance
Show answer
Border of “resistance” visible in the chart. It forms in the space where bid (supply) is higher than ask (demand) while the price doesn’t jump over this level and keeps bouncing back down off of it.
Reverse price patterns
Show answer
Reverse formations signal a reversal of the current trend. The current trend will stop after some time, a consolidation will occur and then a new trend will start. A reverse formation that forms at the top of a move is called a distribution, where active selling of the instrument occurs. On the other hand, the formation that forms at the lower levels is accumulation, which is the area where active purchases will occur.
Support
Show answer
Border of “support” visible in the chart. It forms in the spaces where ask (demand) is higher than bid (supply) while the price doesn’t fall beneath this level and keeps bouncing back up off of it.
67.90 % of retail investors lose their capital when trading CFDs with this provider.
CFDs are complex instruments and come with a high risk of losing money rapidly due to leverage. 67.90 % of retail investors lose their capital when trading CFDs with this provider. You should consider whether you understand how CFDs work and whether you can afford to take the high risk of losing your money.