66.30 % of retail investors lose their capital when trading CFDs with this provider.

CFDs are complex instruments and come with a high risk of losing money rapidly due to leverage. 66.30 % of retail investors lose their capital when trading CFDs with this provider. You should consider whether you understand how CFDs work and whether you can afford to take the high risk of losing your money.

3 trading strategies for 2024

Published: 22.12.2023

The 2024 is shaping up to be a great year for trading. Whether you're new to the game or a seasoned pro, picking the right strategy is key. Check out these three approaches that are potentially effective, helping you make the most of the opportunities this year.

The start of the year is a chance for fresh beginnings and learning something new. Trading keeps evolving, with new methods emerging. To succeed and stay ahead in this tough industry, you can consider steping out of your comfort zone. Learning is ongoing, especially in trading. A successful trader can't afford to stay stagnant.

That's why in this article, we'll dive into three clever strategies used by smart money that can elevate your trading game. To grasp them, you need to understand the basics of price action and the idea of liquidity withdrawal. Smart money strategies flip how traders see market dynamics, revealing new trading possibilities. It's no surprise that these strategies are popular among both newbies and seasoned traders.

Smart Money Strategy No. 1: Pullback of the main trend

For this Smart Money strategy, we will focus on the uptrend and downtrend. An uptrend is typically characterized by making a higher high and a higher low. In the case of a downtrend then the market creates a lower high and a lower low. We can see what this looks like in Figure 1:
 

Rising and falling trend (HH higher high; HL higher low; BOS break structure; LL lower low; LH lower high; CHOCH change of market character)


When the market breaks the previous higher high, it signals a shift in structure, making another higher high and keeping the uptrend intact. This holds until there's a change of character (CHOCH) with the formation of a lower low. Once a lower high is in place and, upon breaking the lower low, another lower high is formed, it marks the beginning of a downtrend.

This scenario is well-known to traders and often leads to orders being placed at key levels like the BOS levels, representing liquidity that smart money targets. These levels act like traps for retail traders, enticing them in only to be scooped up by smart money.

So, when retesting the BOS, it's crucial not to get greedy. Be ready for the chance that the market might test a previous swing low or high where there's also liquidity. This scenario would look like this:
 

Rising trend with retest of previous higher low


In an uptrend, after the market makes a higher high (HH), the retest of the BOS for the higher low (HL) is sometimes "passed." Instead, the price heads to the last higher low (HL), forming an equal low (EL). This level may also be partially "passed," creating the impression of a change in character (CHOCH) and the potential reversal of the trend. This crossing of the level is known as a false break. In this example, it illustrates a common case of "inducement" trapping, where:
 

  1. Traders expecting another upward move at (HL) placed stop loss (SL) orders below this level, and these SLs were triggered.

  2. Traders anticipating a trend change at point EL placed SL orders above this EL, which were also triggered.


Smart money targets these stop losses as they represent liquidity. This explains why the market was trending down at point (HL) and why it turned up at point EL.

In a downtrend, the situation is similar but reversed. After the break of the BOS, the level where a new lower high should form (LH) is "passed." A retest of the previous lower high occurs, ideally with a false break at point EH, before the market continues in the direction of the downtrend.
 

Downtrend with retest of previous lower high

Illustrating the Smart Money pullback in the main trend


Downtrend

We observe a distinct downtrend initiated by a change in character (CHOCH), marked by the formation of the first lower low (LL) after breaking the last higher low (HL). The breakout of the LL creates breakout structures (BOS), presenting opportunities on retests at points 1, 2, and 3. While one could consider going short at these points, the risk-reward ratio would be relatively low, barely reaching 1:1.5 if speculating towards the nearest support.

As a result, we've only included on the chart trades that promise a more compelling return.


Downtrend and pullback trade entries


Situations 4, 5, and 6 involve retests of the preceding lower high (LH), leading to the formation of an equal high (EH). These trades present significantly higher risk/reward potential when speculating toward the closest support, which happens to be the last preceding lower low (LL). Specifically, trade number 4 could yield a profit of 4.5R, trade 5 around 2R, and trade 6 nearly 5R.

Situation 7 represents a retest of the BOS breakout structure, offering a profit of approximately 4R in this case. Over a one-month period, these opportunities could accumulate to a total potential of 15.5R. If 1R, the unit of risk, corresponds to 0.5%, the overall profit would be nearly 8%.
 

Upward trend

 
Bullish trend and trade entries during pullbacks
 

In the SP500 index, we observe a pattern of higher highs (HH) and higher lows (HL). When the HH is breached, it leads to the formation of a break in the structure (BOS). Therefore, one of the entry points is a pullback on the retest of the BOS. This circumstance primarily manifested itself at point 1. Speculating toward the nearest peak in this scenario could create a trade with a potential return of 1R.

The subsequent retest of the BOS occurred at point 2, where the trade would have concluded with a stop loss if entered without confirmation. Another opportunity arises at point 3 with the retest of the prior higher low (HL). While theoretically one could enter a long position here, the trade would later conclude with a stop loss at point 4.

Unlike the earlier example that seemed almost exemplary, this instance highlights the reality that not everything is consistently favorable. There are periods of abundant opportunities and others where trading opportunities are more scarce.

Ebook: How to trade Forex

In this ebook you will find explanation of basic terms and concepts in Forex trading, demonstrations of basic price formations on a chart and how to trade them, recommendations for appropriate trading support tools and much more!

Smart Money Strategy No. 2: Accumulation, Manipulation, Distribution

The concepts of accumulation, manipulation, and distribution have gained recent prominence in smart money trading, notably through YouTube videos by a trader identified by the initials ICT. For those less proficient in English, here are the fundamental principles of this approach, which you can adapt as per your requirements.

Accumulation marks a phase of consolidation and liquidity gathering. Manipulation involves withdrawing liquidity to create the illusion that the market will move counter to the prevailing trend, often termed a false break. The final phase is distribution, characterized by a movement in the direction of the original trend.

This simplified representation is depicted in the following figure:
 

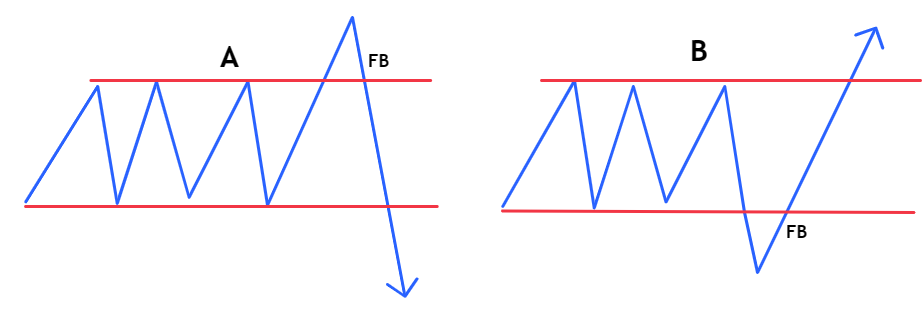
Accumulation, Manipulation, and Distribution within a Bear Trend (A) and within a Bull Trend (B)

In a bear trend (A), a consolidation phase emerges, followed by a withdrawal of liquidity above the consolidation. This withdrawal creates the illusion of a trend reversal, luring traders to enter long positions and set stop-loss orders below the lower level of the consolidation. However, these stop losses represent liquidity, and after a false break (FB) occurs, these new liquidity levels become the target for the "smart money."

In a bull trend (B), the process is analogous. A consolidation forms, followed by a liquidity withdrawal (false break), and then the price resumes its original direction within the bull trend.

The crux of this Smart Money strategy lies in accurately identifying the trend.
 

Illustration of accumulation, manipulation, and distribution on a downward trend


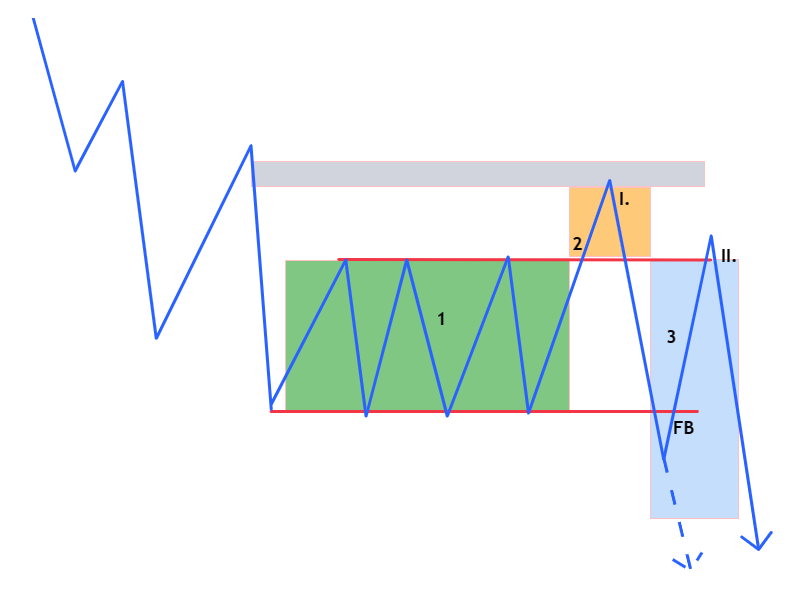
Bearish Trend and Liquidity Selection


In phase 1, there's an accumulation period. Phase 2 involves a withdrawal of liquidity by traders who speculated on an upward break. The price seeks a logical point where this liquidity selection halts, which might be an unfilled Price Value Gap, an order block, etc. The first potential entry point for short positions is indicated here (point I).

Following liquidity selection, distribution unfolds in phase 3, and the price resumes its original trend. Occasionally, a false break of the lower trend line may occur, prompting the price to make a final upward move to trigger the stop losses (at point II) of traders who previously speculated on a downturn. Once this liquidity is collected, patient traders can find another opportunity for short positions (point II).
 

Illustration of accumulation, manipulation, and distribution on an upward trend

In the context of a bullish uptrend, the scenario is comparable. A consolidation is established (1), followed by a false break (2), presenting the initial opportunity for a long entry (I). The second potential entry point for a long position arises if a false break occurs during the distribution phase (3). Here, the "smart money" once again targets the stop losses (at point II) of traders who previously speculated on an upward move, creating the illusion of a market reversal.

The ultimate long entry occurs at point II when liquidity has already been selected.
 

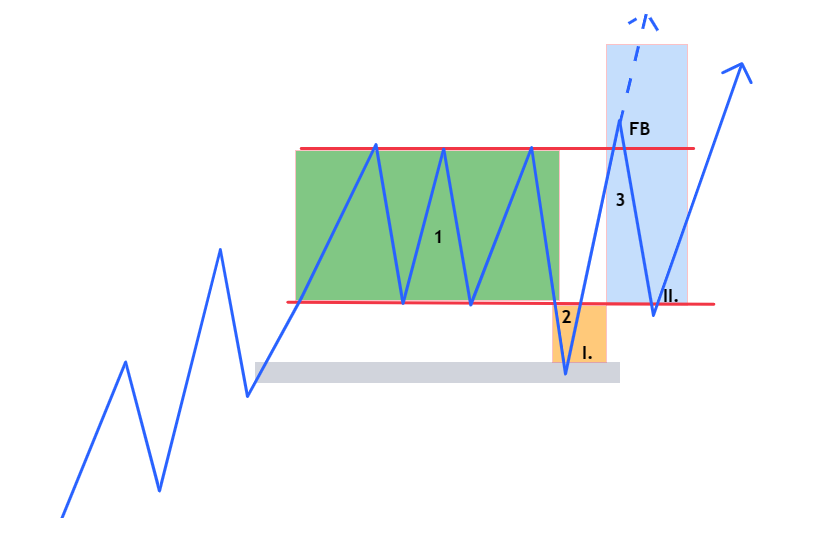
Bullish trend and liquidity selection


What Smart Money accumulation, manipulation, and distribution looks like in practice


Long na EURUSD na 30minutovém grafu
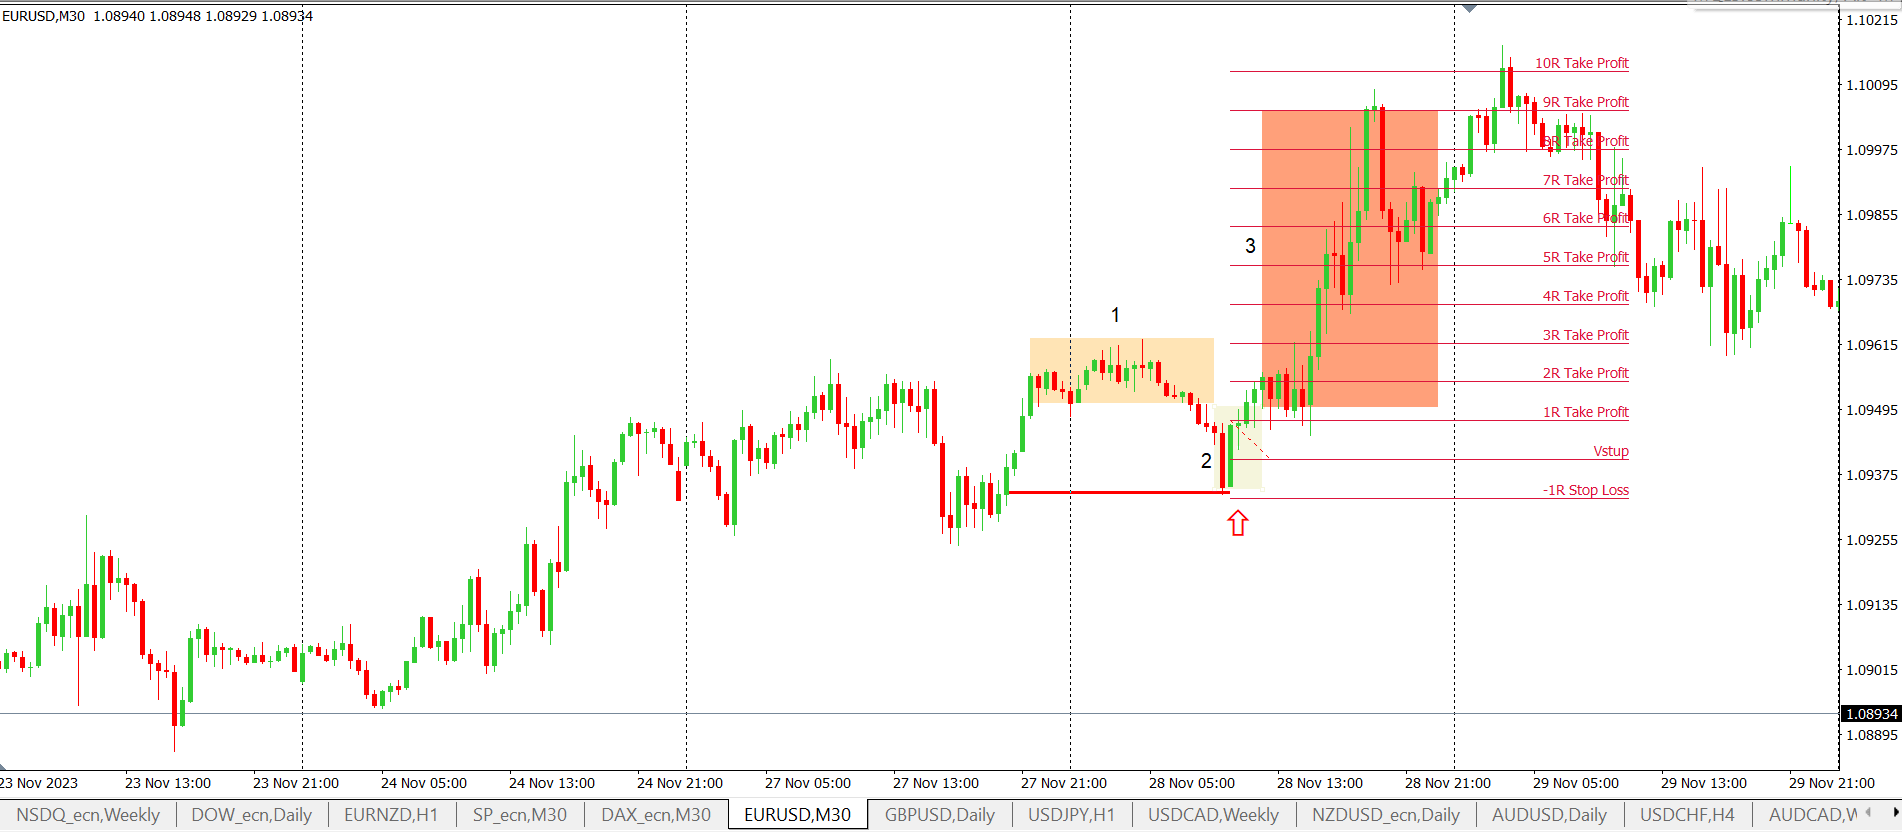
Long Position on EURUSD - 30-Minute Chart
 

On the 30-minute chart, we can clearly see an uptrend. Within this trend, there was a distinct accumulation phase (1). Subsequently, a false break occurred, as observed in phase 2. Following the false break, the price rebounded and continued its upward trajectory (phase 3).

If one were to speculate toward the nearest peak from the accumulation phase, the trade would have yielded a profit of 3R. To refine the entry point, it is advisable to optimize on a lower time frame, such as the 5-minute chart.
 

Potvrzení vstupu pomocí engulf a order bloku na 5minutovém grafu
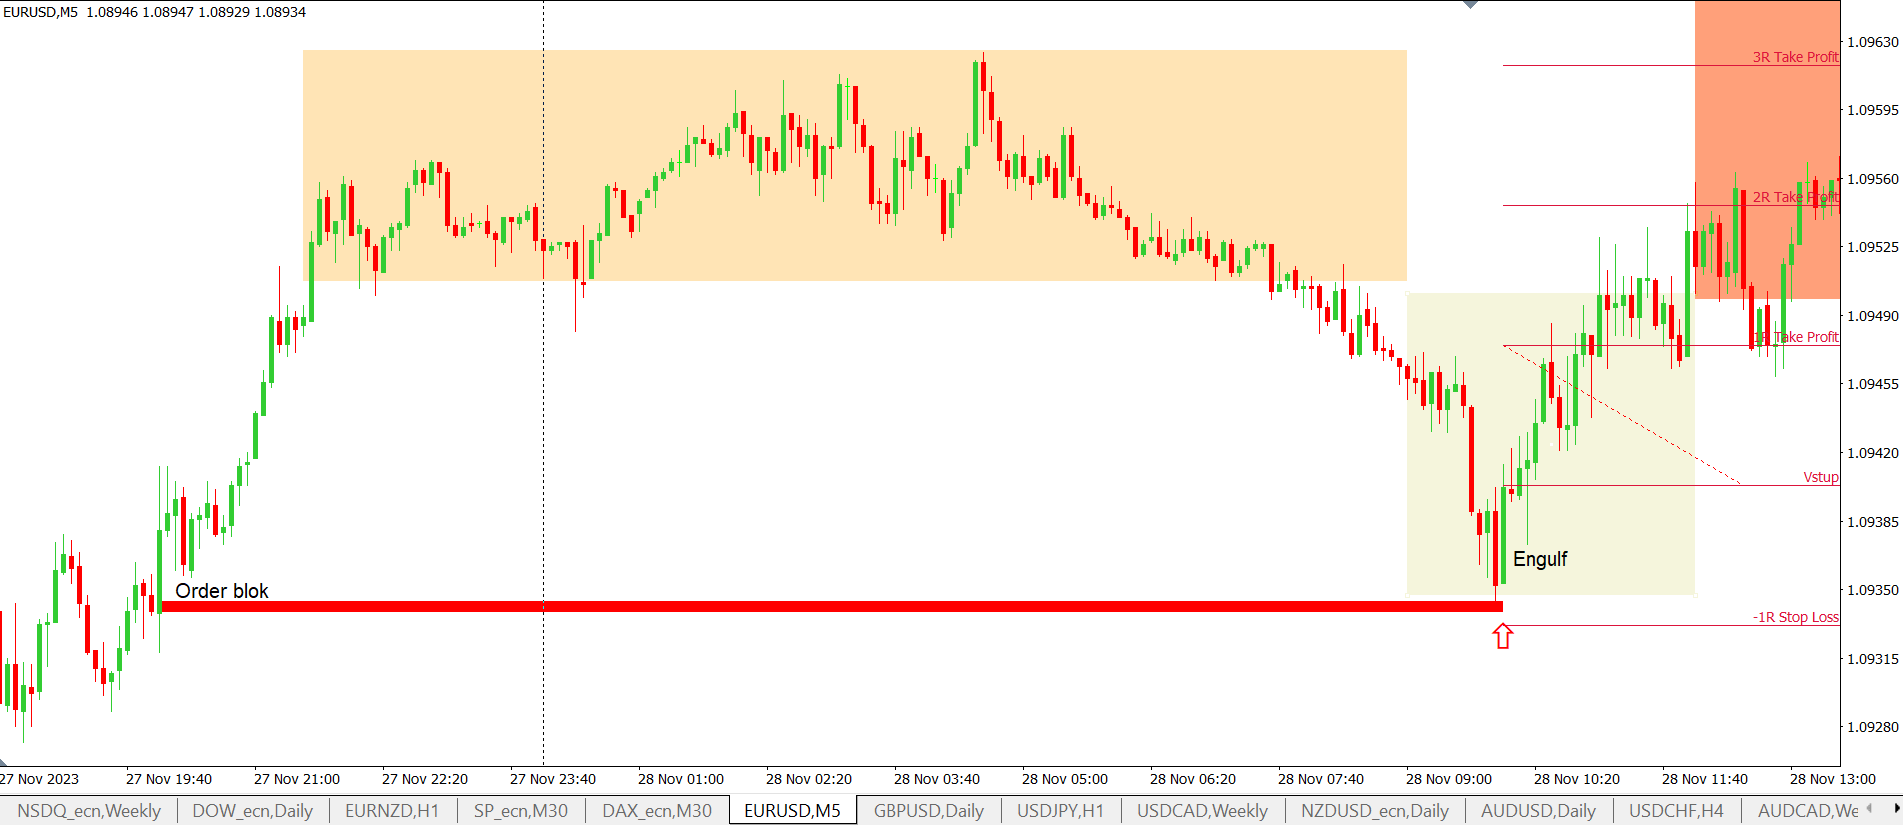
Confirmation of Entry using Engulf and Order Block on the 5-Minute Chart


In our scenario, it's worth noting that the price halted at the order block from which it had previously surged. The entry is then based on a signal, which could be a reversal engulfing candle formation (as depicted in the image), a pin bar, or a Price Value Gap.

In the next illustration, we have an example of a downtrend on the H4 chart. Once again, an accumulation phase (1) is evident. During the manipulation phase (2), the price reaches the previous swing where liquidity was selected, indicated by the slight breach of this horizontal resistance. Subsequently, distribution (3) unfolds. Speculating toward the nearest support in this trade would have resulted in a gain of R3.5.

This emphasizes the importance of confirmation signals, such as candle patterns, to enhance entry precision and align with the broader trend dynamics.


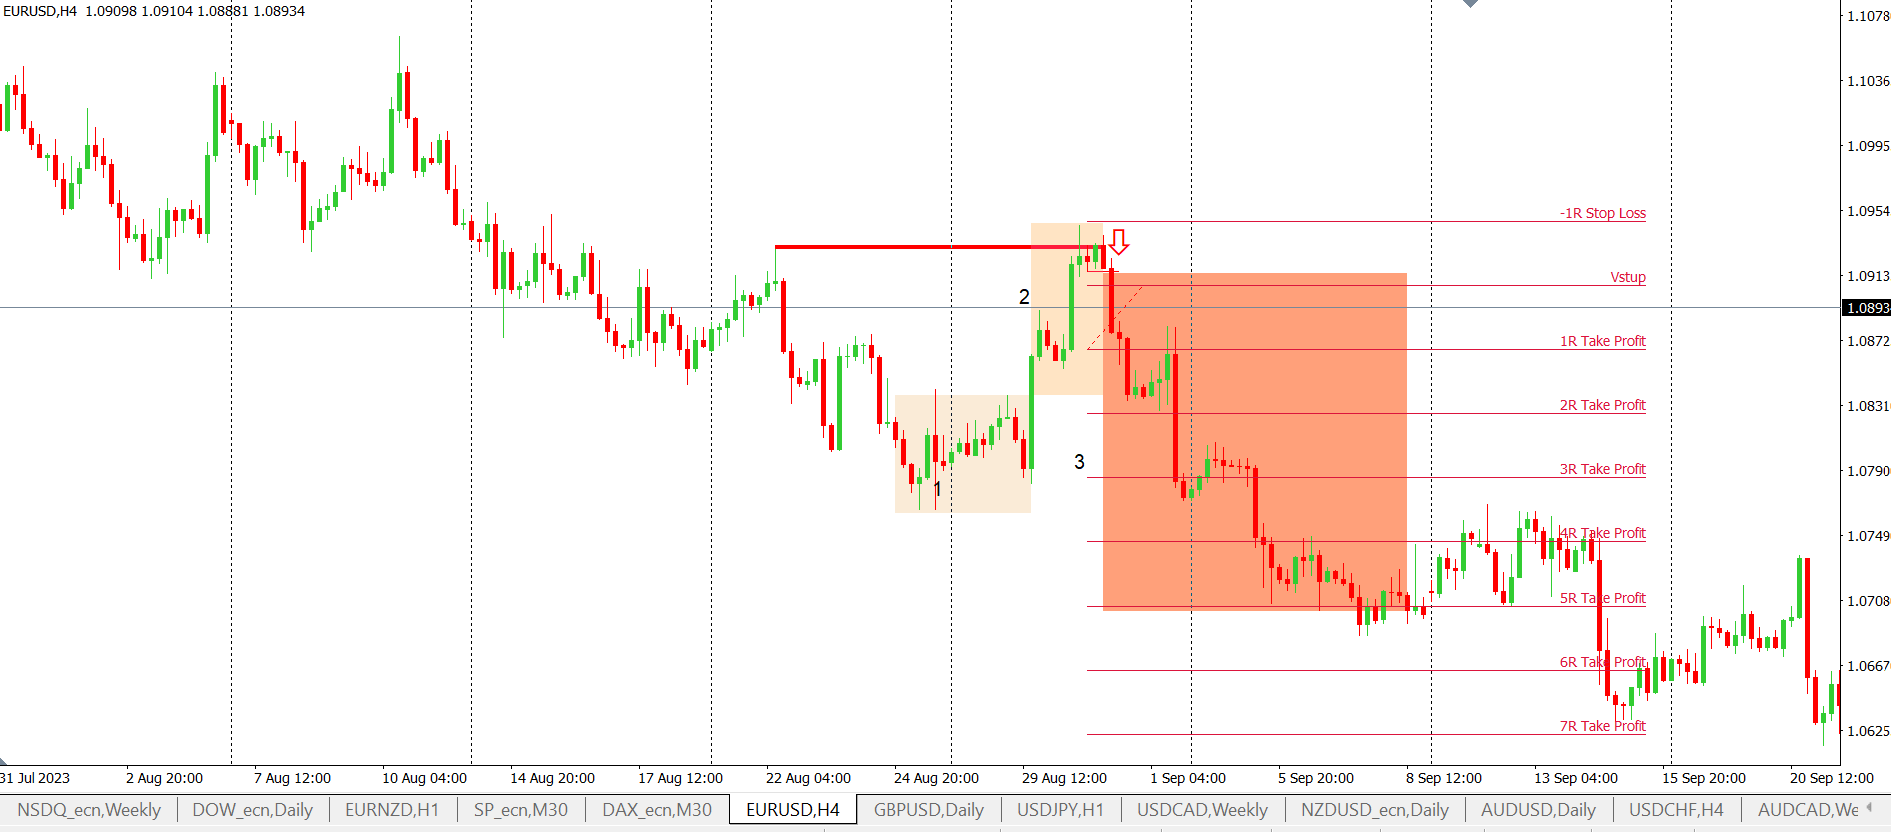
Short na EURUSD na H4 grafu


To optimize the entry we move to a lower frame, in this case for example H1.
 

Potvrzení vstupu na H1 grafu pomocí platného průrazu support
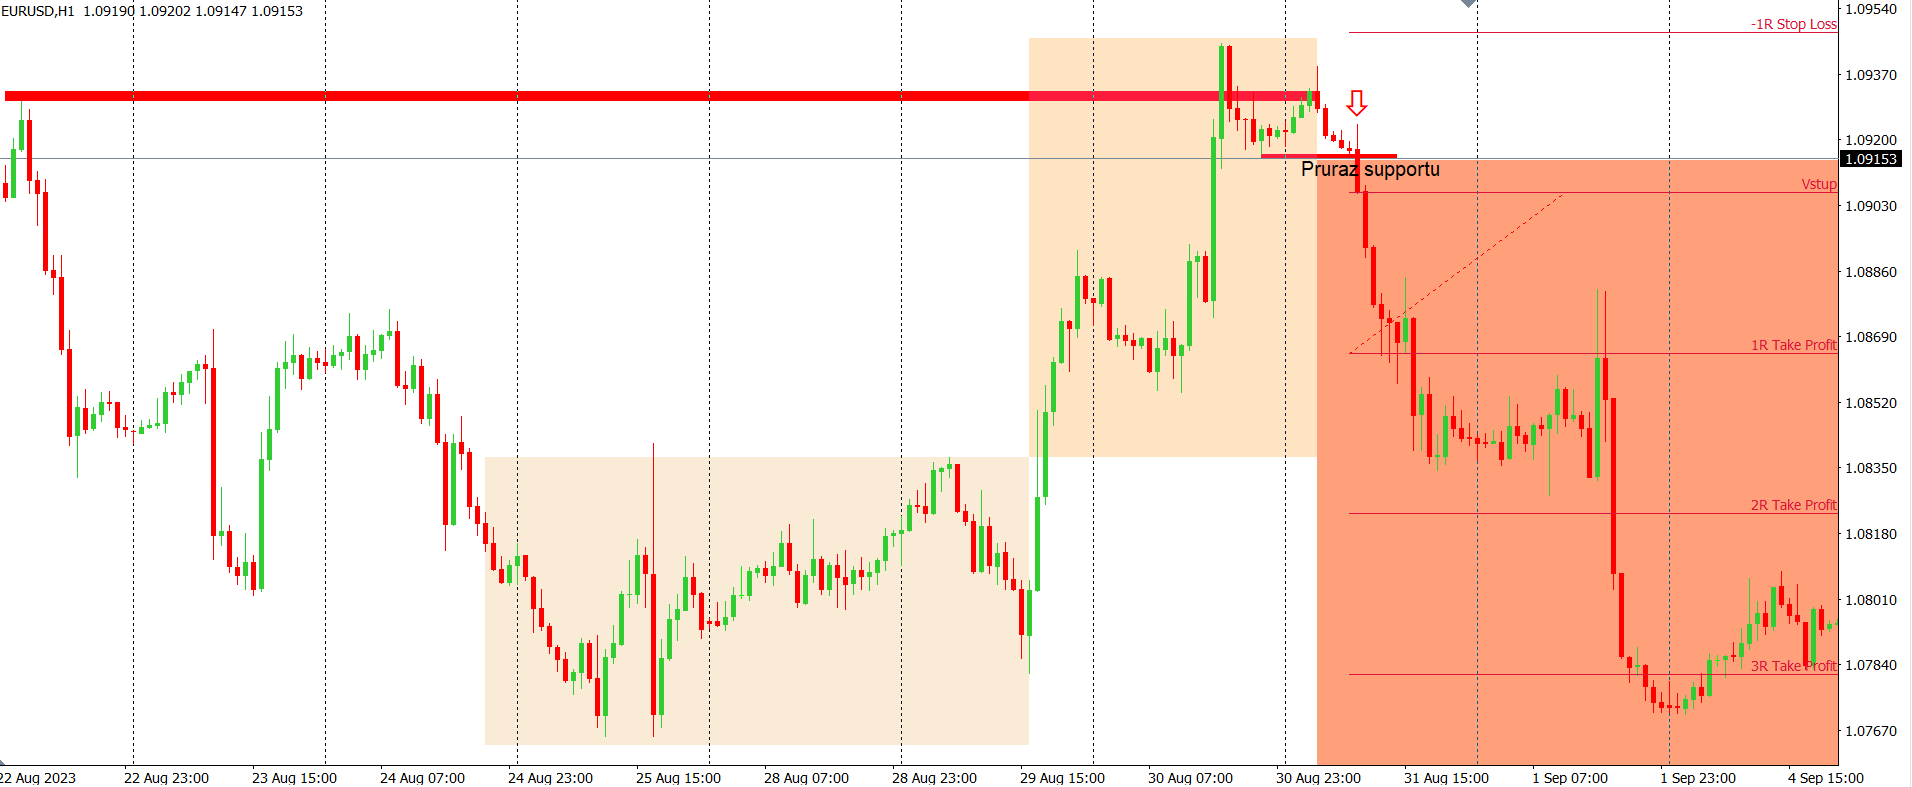
Confirmation of H1 chart entry using valid breakout support


We can see that a strong bearish candle has broken support, which is an indication that the market is turning down.

Boost your trading knowledge with Purple Academy!

Successful trader never stops learning. That is why we have created the Purple Academy where you can find interesting articles, knowledge-expanding ebooks and detailed trading turorials. So if you are interested, just dive in and start learning! (It’s free).

Smart Money Strategy No. 3: Correlation Between US Stock Indices

Traders should pay close attention to the correlation between the SP500 and the NASDAQ (or DJ30). Utilizing these correlations can serve as a confirmation tool for trades or as an indicator to assess the potential future direction of the index.

We will illustrate the significance of these correlations using a weekly chart:
 

Correlation Between NASDAQ and SP500 on the Weekly Chart


The formations of both the SP500 and NASDAQ indices are nearly identical. However, variations can emerge concerning support and resistance. For instance, one index might rebound from a support level, while the other breaks through it, only to later climb back above the support if the first index is still on an upward trend, and so on. These distinctions between indices are often more pronounced in lower time frames. In the subsequent illustration, we present a specific example on a 15-minute chart.
 

NASDAQ and SP500 on the 15-Minute Chart


At point 2, there was a false break of resistance on the SP500 index, while the NASDAQ remained below resistance. False breaks serve as robust signals indicating selected liquidity, making it a potential entry point for a short position. The take-profit target would be the nearest support. Notably, the two indices diverged in this aspect. For the NASDAQ index, the nearest support was identified by the pinbar (1), whereas for the SP500 index, the support was identified by the order block (1).

By aiming for the specified take profits, a trade in the SP500 index would have yielded a profit of 3R, while in the NASDAQ, it would be 2R. All of this occurred within just a few minutes of trading.

Recommended articles

66.30 % of retail investors lose their capital when trading CFDs with this provider.

CFDs are complex instruments and come with a high risk of losing money rapidly due to leverage. 66.30 % of retail investors lose their capital when trading CFDs with this provider. You should consider whether you understand how CFDs work and whether you can afford to take the high risk of losing your money.