66.30 % of retail investors lose their capital when trading CFDs with this provider.

CFDs are complex instruments and come with a high risk of losing money rapidly due to leverage. 66.30 % of retail investors lose their capital when trading CFDs with this provider. You should consider whether you understand how CFDs work and whether you can afford to take the high risk of losing your money.

SP500 Index – Definition and Characteristics

The SP500 (Standard and Poor's 500) index is a stock market index composed of 500 large companies traded on stock exchanges in the United States of America. The SP500 is a capitalization-weighted index. The performance of the ten largest companies in the index account for 21.8% of the performance of the index. The SP500 index is one of the four major US equity indices; the other three are Dow Jones 30, Nasdaq 100 and Russell 1000.

Investing benchmark

This index is known as the benchmark for the whole investing world. All the asset managers, hedge funds, investors, traders, and everyone in the investing community compare their results against the SP500 index. The SP500 index is called "the market."

If someone's yearly return is above the SP500 index, it means that this portfolio manager beat the market, or we can also say that he overperformed the market. On the other hand, if an investor fails to make the index' yearly return, he underperformed the market.

Buying the SP500 index is one of the most comfortable and most efficient ways of investing – you don't need any investing knowledge, you just buy the market and let it carry with you.
 

History and performance

Since its inception in 1926, the average yearly return has been 9.8%, and the index posted annual gains in 70% of all years. Moreover, the average annual return has been a bit higher over the last ten years, mainly due to the ultra-loose monetary policy of the US central bank.

Let's take a look at the SP500 monthly chart. Since the 2008 low of 666 points, the index has nearly quintupled over the ten years as it reached new record highs above 3,330 points in February 2020.


SP500


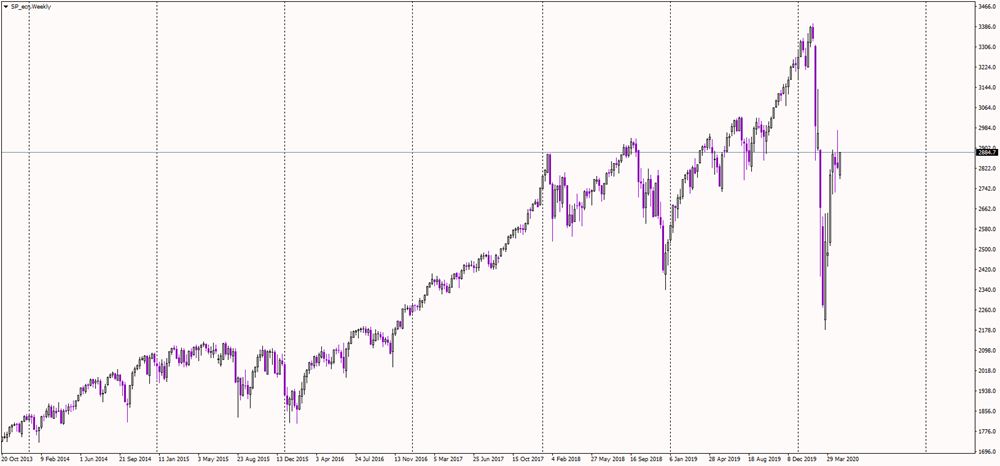
We previously said that buying this index could be one of the most efficient ways of investing, and now you can see why – the index has gone nowhere but up, with all corrections being only mild. Each dip has been bought, and US equities remain the best performers across the globe.

If you are not an investor, but you prefer the trading approach – don't worry! The index is volatile and very liquid, which attracts the majority of short-term traders. By the way, using margin, you combine both approaches – you can buy and hold and still have some margin left for short-term trading.

Fundamental situation

As always, there is technical analysis, and then there is a fundamental analysis. However, both are somewhat losing their relevance lately, because US equities tend to be driven only be the one thing nowadays – that is the Fed's balance sheet. Some companies are trading at unimaginable valuations, some companies are reporting weak earnings, yet their stocks rally and investors seem to be blinded by the Fed.

Many portfolio managers have been calling the latest push higher the biggest bubble ever, and it has not burst yet, despite the 30% decline after the coronavirus sell-off. Other asset managers are as bullish as ever, mainly due to the Fed printing money at an unprecedented pace.

Over the long-term, US equities always go up. But sometimes the timing is crucial, so be careful when trading/investing.


SP500 index - quotes and trading

If you want to trade the SP500 index, take a look at the picture below.

SP500 kotace

Source: Purple Trading Metatrader 4
 

Lot value calculation

When you click on the SP ticker in our Metatrader 4 platform, you can see that the spread between the Ask and Bid price is 0.50 USD during the times of high liquidity (usually when London and New York are open for trading).

The minimal volume for this index is one micro lot (0.01). If you trade a micro lot, you will earn or lose 50 cents per each USD the index makes. If you trade a mini lot (0.1), you will earn or lose 5 USD for each USD the index makes. When trading half a lot, each USD of the index movement will yield 25 USD of profit/loss. For example, you buy half a lot at 2,900 USD, and the index goes to 2,950 USD. Your total profit will be 1,250 USD (calculated as 50 USD movement * 25 USD profit per each USD of the move). The same logic applies to calculate your profit or loss when entering a short position.

Keep in mind, that this index is quoted in US dollars; thus, if your account is in EUR, each point of the index will yield circa 0.90 EUR loss/profit.

As with everything, you can trade at the current market price (market execution), or you can use pending orders (limit and stop orders). It's not necessary to enter the stop-loss and take-profit order right now – you can open the trade without them and add them later.

Open an account and trade with us!

 
Your capital is at risk.
66.30 % of retail investors lose their capital when trading CFDs with this provider.

CFDs are complex instruments and come with a high risk of losing money rapidly due to leverage. 66.30 % of retail investors lose their capital when trading CFDs with this provider. You should consider whether you understand how CFDs work and whether you can afford to take the high risk of losing your money.