The third part of our mini-series of articles will show you what data to watch when trading oil. In addition to trading oil in a fundamental way, we will also show you indicators for trading oil by technical analysis.
Needless to say, oil is the driving force behind today's global economy, making it the most traded commodity in the world.
Thanks to characteristics such as the interesting volatility of oil during the trading day or the abundance of economic and technical indicators that help predict the direction of the oil price in the short term, oil trading has many ardent devotees among financial market traders.
At Purple Trading, we try to cater to the needs of all traders, oil devotees included. That is why we offer oil trading via CFD contracts. At the same time, we offer regular info services in the form of up-to-date analyses and webinars to help traders navigate through the turbulent waves of oil trading.
Incidentally, this article is another of many pieces in the informative mosaic of Purple Trading and as such, it should show you what indicators can help you trade oil.
Macroeconomic Fundamental Indicators
Oil reserves
Oil reserves are an indicator that shows the amount of oil currently stored for future use. The state of this indicator and its changes over time give traders an idea of the evolution of oil production and consumption over a certain period. This indicator is published by the Energy Information Administration (EIA) every Wednesday at 4:30 p.m. our time and includes all U.S. crude oil that is currently stored at refineries, pipelines, and pipeline terminals.
In its basic form, this indicator is also available at www.investing.com.
The release of crude oil inventories is almost always accompanied by higher volatility because it is a report of major importance. Therefore, you should be cautious at the time of publication of this report.
If oil reserves are rising gradually, this indicates that production is exceeding demand, which should lead to lower energy prices. Conversely, if oil reserves are falling, then demand is exceeding supply and the price of oil should rise.
Monthly OPEC reports
OPEC is an organization of oil exporting countries, currently made up of 13 member countries (Algeria, Angola, Congo, Equatorial Guinea, Gabon, Iran, Iraq, Kuwait, Libya, Nigeria, Saudi Arabia, United Arab Emirates, and Venezuela). These countries control 40% of the global oil supply and up to 75% of total reserves. It is therefore not surprising that this report has a profound effect on oil prices.
In fact, the following chart shows the impact of news regarding OPEC's activities on the price of oil.
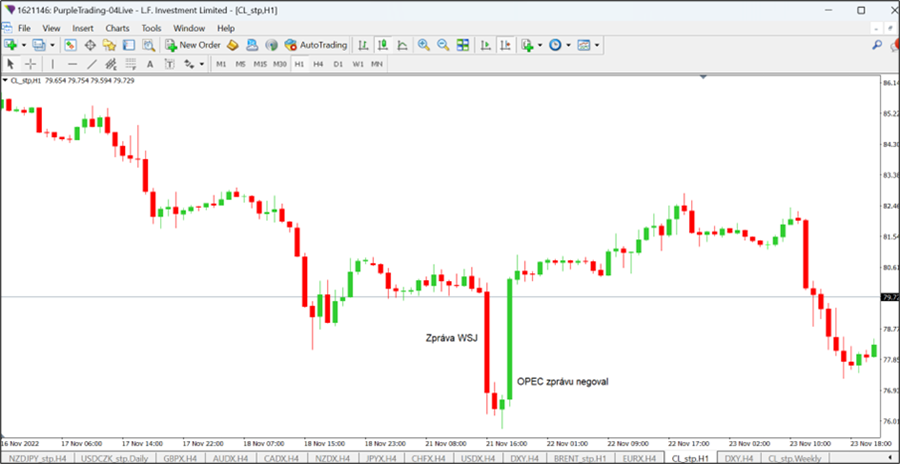
WTI crude oil at the time of the WSJ report on 11/21/2022
Here we see that on November 21, 2022, the WSJ published a report that OPEC was considering increasing oil production by 500,000 barrels per day. The price of WTI oil immediately fell from $80 per barrel to $76. Brent oil fell from $87 to $83 per barrel. A few hours later, however, OPEC denied the report and the oil price jumped back to its original levels.
What does this imply?
Oil cannot be successfully traded in the long term without monitoring OPEC news and reports. This is even more true if you are swing trading oil and want to hold oil positions for several weeks or months.