The Swing Overview – Week 28 2022
This week's new record inflation readings sent a clear message to central bankers. Further interest rate hikes must be faster than before. The first of the big banks to take this challenge seriously was the Bank of Canada, which literally shocked the markets with an unprecedented rate hike of a full 1%. This is obviously not good for stocks, which weakened again in the past week. The euro also stumbled and has already fallen below parity with the usd. Uncertainty, on the other hand, favours the US dollar, which has reached new record highs.
Macroeconomic data
The data from the US labour market, the so-called NFP, beat expectations, as the US economy created 372 thousand new jobs in June (the expectation was 268 thousand) and the unemployment rate remained at 3.6%. But on the other hand, unemployment claims continued to rise, reaching 244k last week, the 7th week in a row of increase.
But the crucial news was the inflation data for June. It exceeded expectations and reached a new record of 9.1% on year-on-year basis, the highest value since 1981. Inflation rose by 1.3% on month-on-month basis. Energy prices, which rose by 41.6%, had a major impact on inflation. Declines in commodity prices, such as oil, have not yet influenced June inflation, which may be some positive news. Core inflation excluding food and energy prices rose by 5.9%, down from 6% in May.
The value of inflation was a shock to the markets and the dollar strengthened sharply. We can see this in the dollar index, which has already surpassed 109. We will see how the Fed, which will be deciding on interest rates in less than two weeks, will react to this development. A rate hike of 0.75% is very likely and the question is whether even such an increase will be enough for the markets. Meanwhile, there has been an inversion on the yield curve on US bonds. This means that yields on 2-year bonds are higher than those on 10-year bonds. This is one of the signals of a recession.
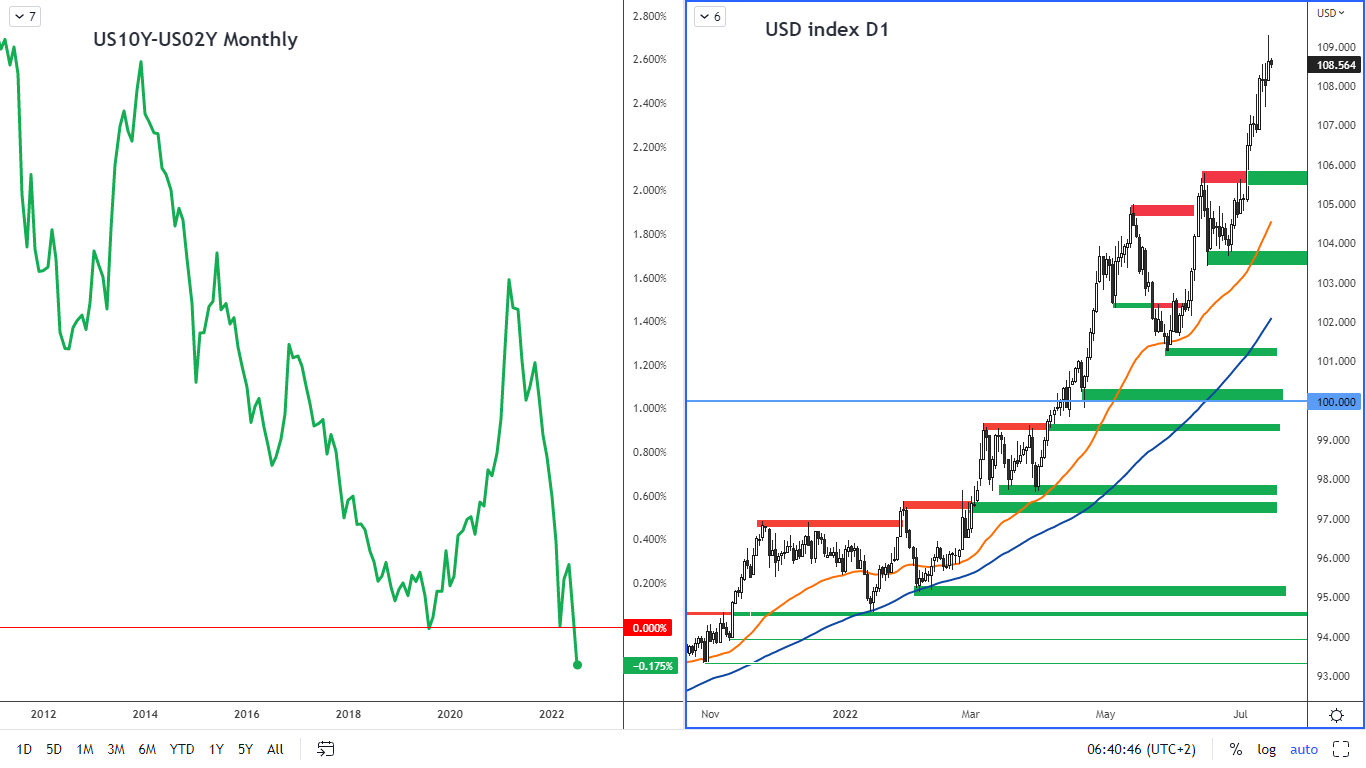
Figure 1: The US Treasury yield curve on the monthly chart and the USD index on the daily chart
The SP 500 Index
Apart from macroeconomic indicators, the ongoing earnings season will also influence the performance of the indices this month. Among the major banks, JP Morgan and Morgan Stanley reported results this week. Both banks reported earnings, but they were below investor expectations. The impact of more expensive funding sources that banks need to finance their activities is probably starting to show.
We must also be interested in the data in China, which, due to the size of the Chinese economy, has an impact on the movement of global indices. 2Q GDP in China was 0.4% on year-on-year basis, a significant drop from the previous quarter (4.8%). Strict lockdowns against new COVID-19 outbreaks had an impact on economic situation in the country.
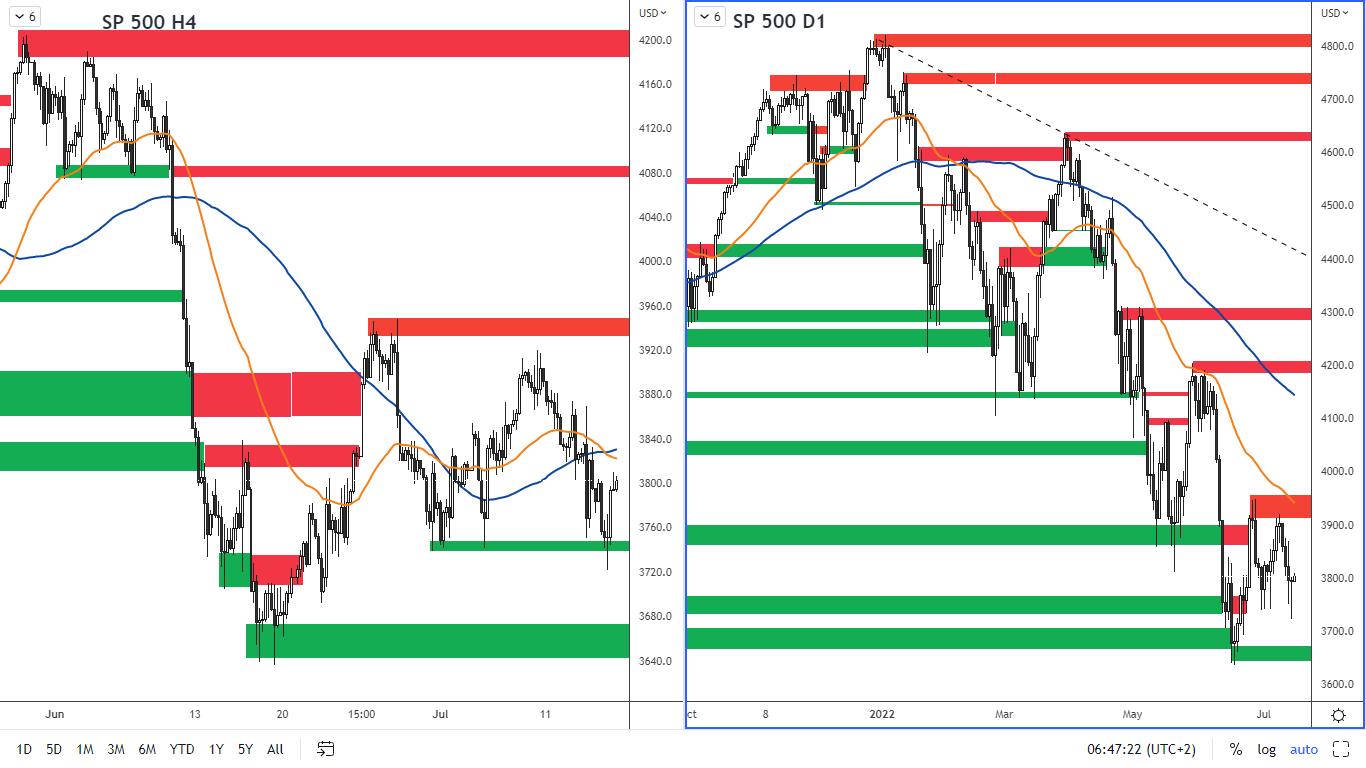
Figure 2: SP 500 on H4 and D1 chart
The threat of a recession is seeping into the SP 500 index with another decline, which stalled last week at the support level, which according to the H4 is in the 3,740-3,750 range. The next support is 3,640 - 3,670. The nearest resistance is 3,930 - 3,950.
German DAX index
The German ZEW sentiment, which shows expectations for the next 6 months, reached - 53.8. This is the lowest reading since 2011. Inflation in Germany reached 7.6% in June. This is lower than the previous month when inflation was 7.9%. Concerns about the global recession continue to affect the DAX index, which has tested significant supports.
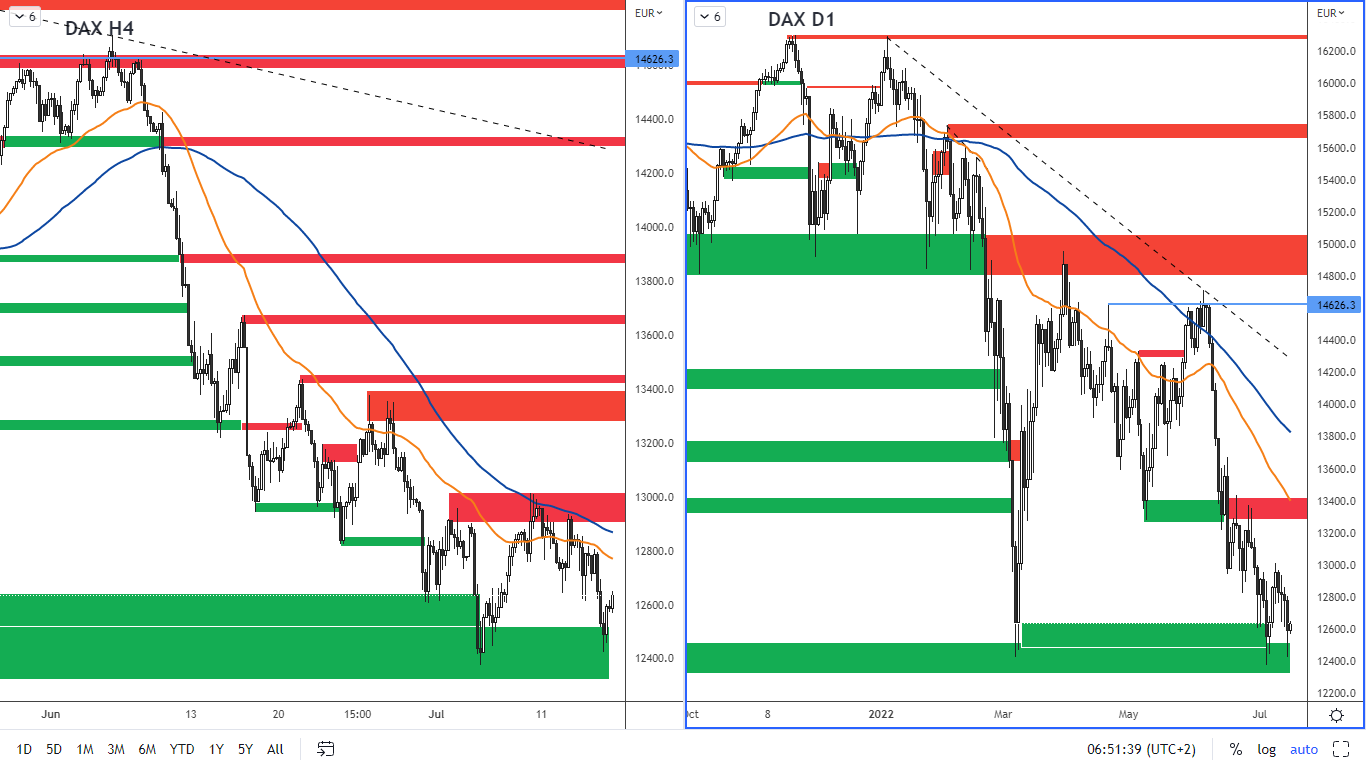
Figure 3: German DAX index on H4 and daily chart
Strong support according to the daily chart is 12,443 - 12,500, which was tested again last week. We can take the moving averages EMA 50 and SMA 100 as a resistance. The nearest horizontal resistance is 12,950 - 13,000.
The euro broke parity with the dollar
The euro fell below 1.00 on the pair with the dollar for the first time in 20 years, reaching a low of 0.9950 last week. Although the euro eventually closed above parity, so from a technical perspective it is not a valid break yet, the euro's weakening points to the headwinds the eurozone is facing: high inflation, weak growth, the threat in energy commodity supplies, the war in Ukraine.
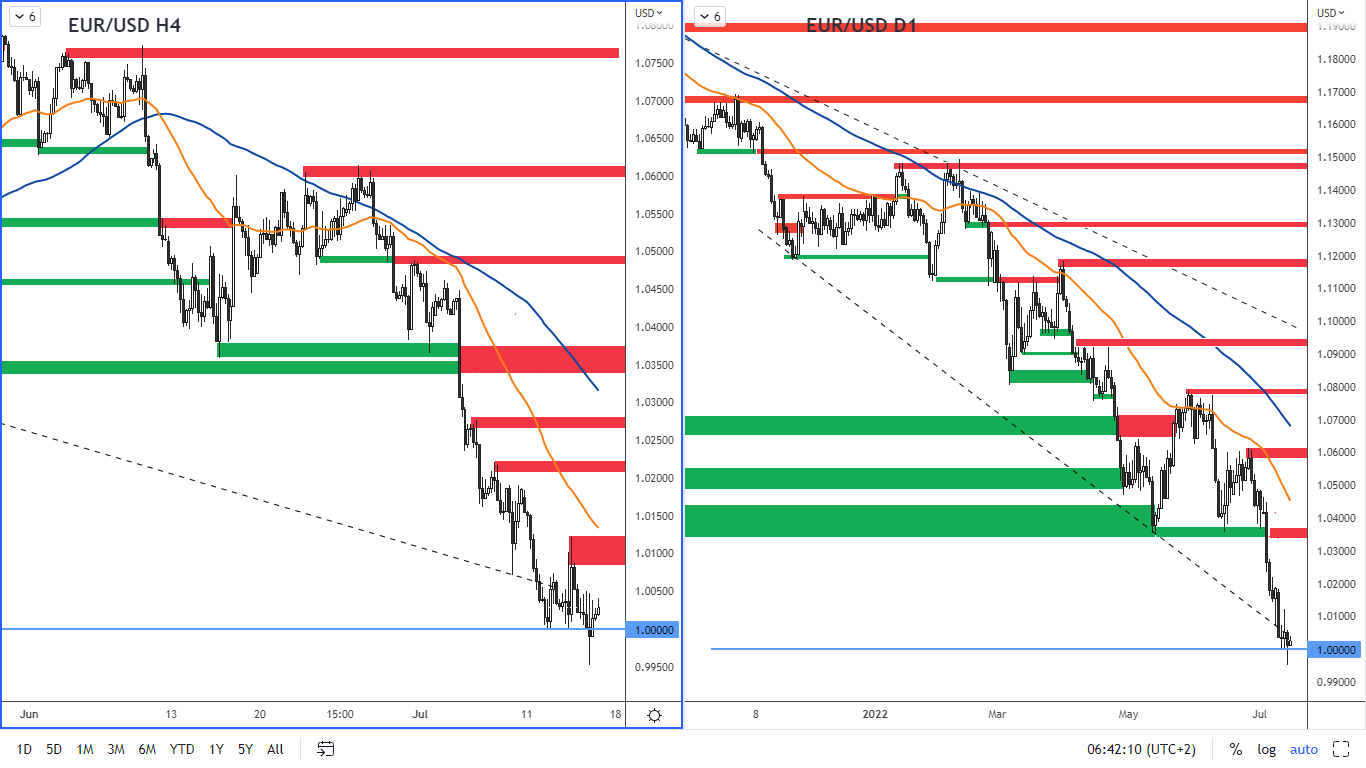
Figure 4: EUR/USD on H4 and daily chart
Next week the ECB will be deciding on interest rates and it is obvious that there will be some rate hike. A modest increase of 0.25% has been announced. Taking into account the issues mentioned above, the motivation for the ECB to raise rates by a more significant step will not be very strong.
The euro therefore remains under pressure and it is not impossible that a fall below parity will occur again in the near future.
The nearest resistance according to the H4 chart is at 1.008 - 1.012. A support is the last low, which is at 0.9950 - 0.9960.
Bank of Canada has pulled out the anti-inflation bazooka
Analysts had expected the Bank of Canada to raise rates by 0.75%. Instead, the central bank shocked markets with an unprecedented increase by a full 1%, the highest rate hike in 24 years. The central bank did so in response to inflation, which is the highest in Canada in 40 years. With this jump in rates, the bank is trying to prevent uncontrolled price increases.
The reaction of the Canadian dollar has been interesting. It strengthened significantly immediately after the announcement. However, then it began to weaken sharply. This may be because investors now expect the US Fed to resort to a similarly sharp rate hike.

Figure 5: USD/CAD on H4 and daily chart
Another reason may be the decline in oil prices, which the Canadian dollar is correlated with, as Canada is a major oil producer. The oil is weakening due to fears of a drop in demand that would accompany an economic recession.
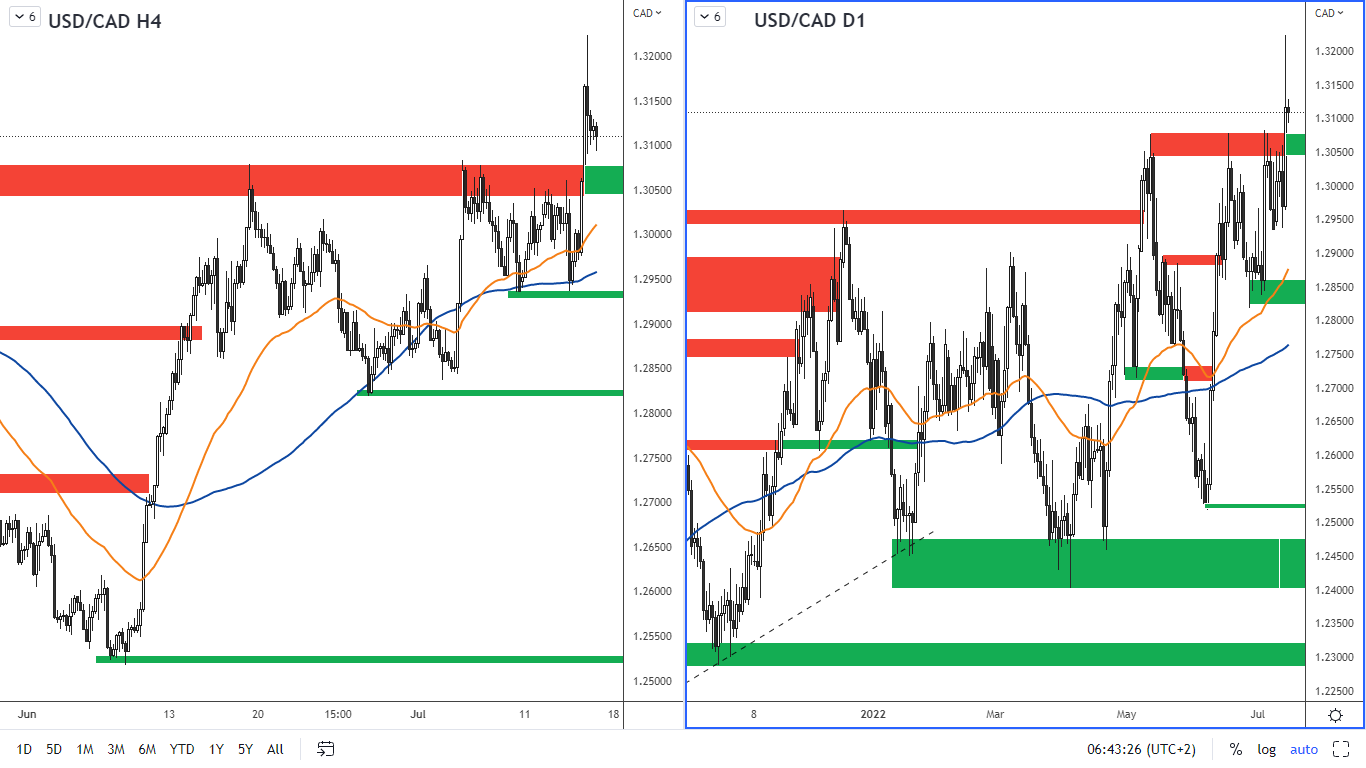
Figure 6: Oil on the H4 and daily charts
Oil is currently in a downtrend. However, it has reached a support value, which is in the area near $94 per barrel. The support has already been broken, but on the daily chart oil closed above this value. Therefore, it is not a valid break yet.