The Swing Overview - Week 26 2022
After ashort-term upward correction, the indices resumed their bearish trend and closed the week in the red. Along with this risk-off sentiment, commodity currencies weakened, as did the British pound and the euro. Gold is losing ground as a means of inflation protection and has fallen back below the USD 1,800 per ounce. The US dollar, on the other hand, is still the strongest currency amid the looming recession.
Macroeconomic data
The number of new home sales in the US for May reached 696,000, beating expectations of 588,000. This is positive news.
On the other hand, the negative news is the drop in consumer confidence, which reached 98.7 for May (103.2 the previous month). The drop in consumer confidence is expected to affect consumer spendings. It is evident that American consumers are reluctant to spend in times of rising prices and are accumulating savings for the future. This is of course contributing to the economic slowdown and the risk of a recession in the US is thus becoming stronger. This was confirmed by the GDP data, which fell for the third month in a row.
The fall in GDP last month was 1.6%. GDP was therefore negative in 1Q 2022. If it is also negative in 2Q2022, it will be an official confirmation of the recession defined by two negative quarters in a row. Jerome Powell suggested this week that the risk of the economy being damaged by higher rates is less important than restoring price stability. This heightens fears that a slowdown in the US economy will take the whole world down with it. So in times when central banks are tackling inflation, this risk will set the tone for some time.
This situation is positive for the US dollar, which is seen by investors as a safe haven asset in times of uncertainty. The dollar therefore remains close to this year's highs. Although the yield on 10-year US Treasuries has fallen below 3%, the overall trend in bond yields is still upwards.
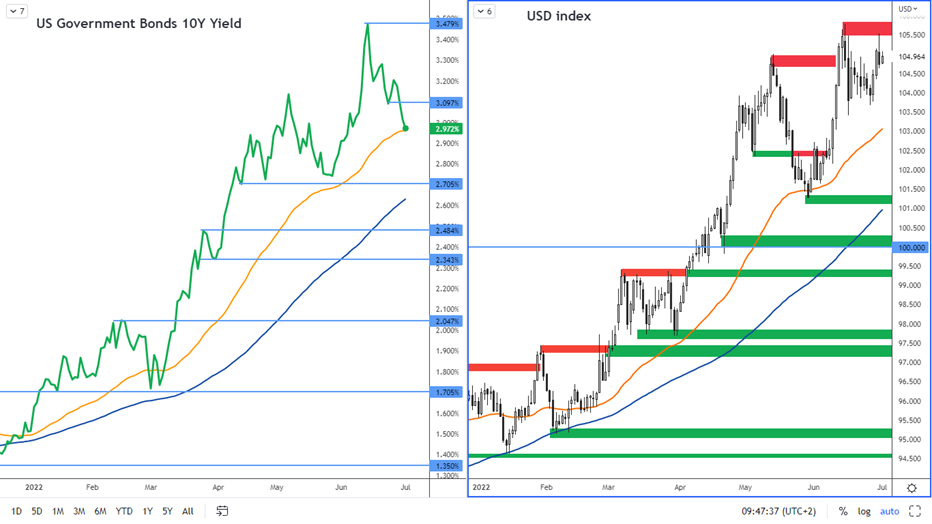
Figure 1: US 10-year bond yields and USD index on the daily chart
The SP 500 Index
The strengthening on the SP 500 Index that we have seen in the week of June 20 was really just a short-term correction to the overall downtrend, as we have previously suggested. Last week saw another sell-off and so the overall downtrend on the index continues.
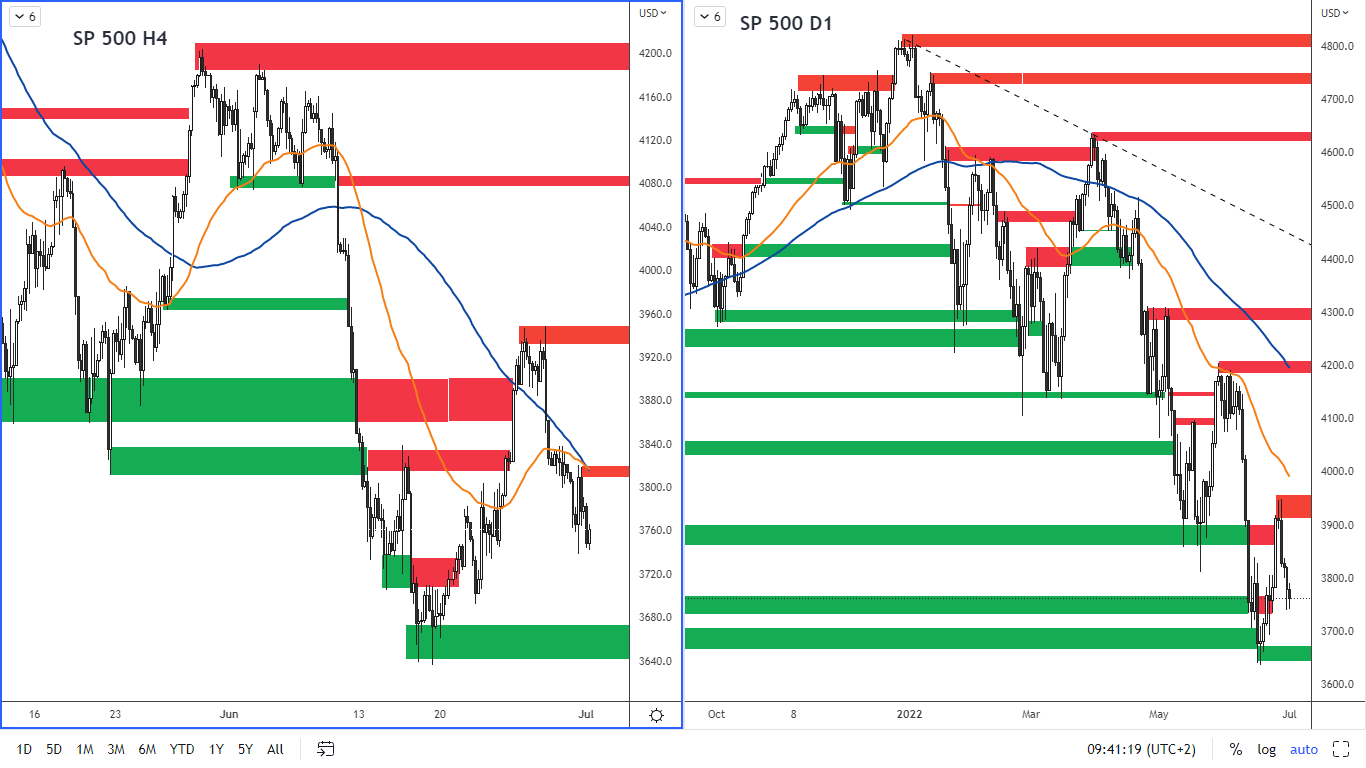
Figure 2: The SP 500 on H4 and D1 chart
The nearest resistance according to the H4 chart is in the range of 3,810 - 3,820. The next resistance is 3,930 - 3,950. A support is 3 640 - 3 670.
German DAX index
The German Ifo Business Climate Index which measures the expectations of manufacturers, builders and sellers for the next 6 months continued to show a value of 92.3, which is worse than the previous month when the index value was 93.0. The fall in the reading suggests some pessimism, accentuated by current market uncertainties, which include the impact of the war in Ukraine and high inflation, which in Germany for the month of June was 7.6% year-on-year. However, inflation fell by 0.1% month-on-month.
The labour market has also indicated problems.
The number of unemployed in Germany rose by 133 000, while the market had expected a fall of 6 000. This was very negative news, which triggered a strong sell-off on the Dax on Thursday.
On the other hand, retail sales were positive, rising by 0.6% in May, while a 5.4% decline was recorded in April.
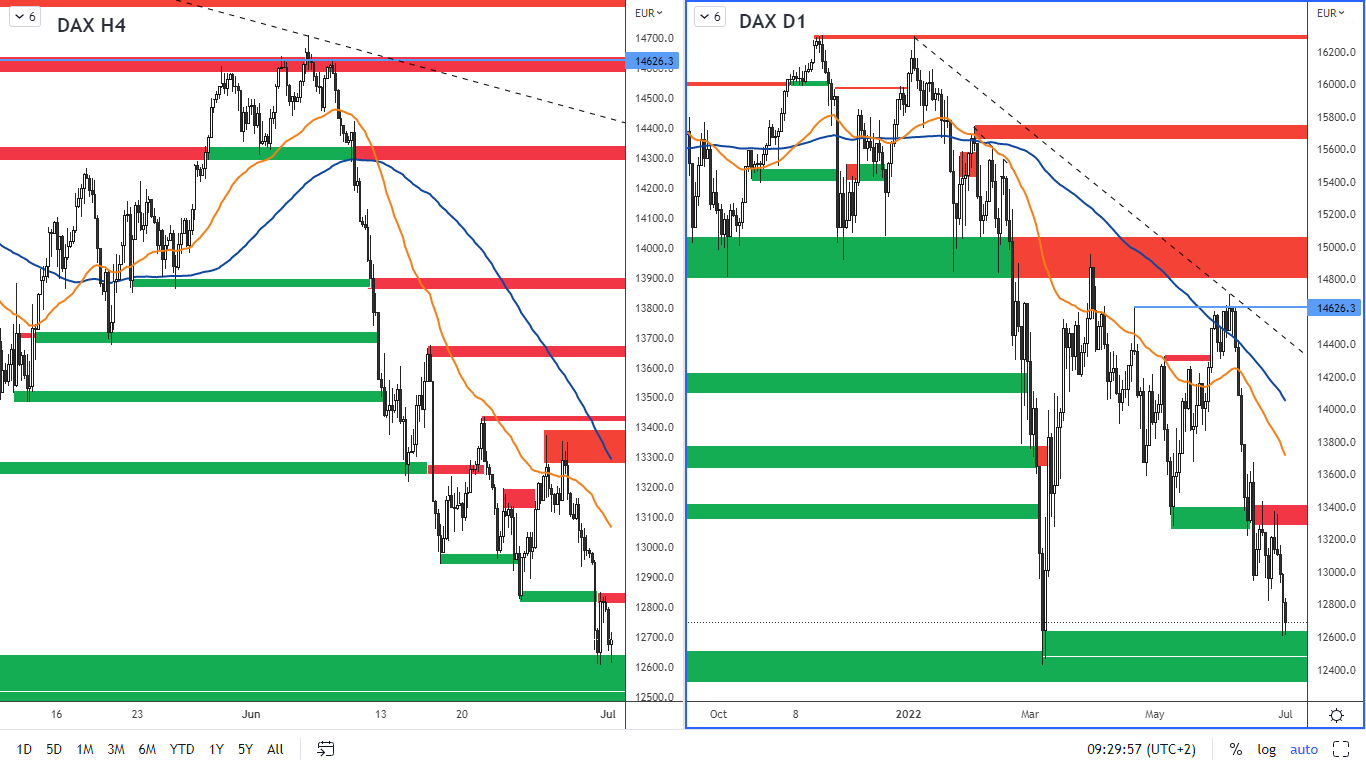
Figure 3: German DAX index on H4 and daily chart
The DAX has broken support according to the H4 chart at 12,850, which has now become the new resistance, which is in the 12,820 - 12,850 range. The next resistance according to the H4 chart is then at 13,280 - 13,375. The strong support according to the daily chart is 12,443 - 12,620, which price is currently approaching.
Eurozone inflation at a new record
Eurozone consumer inflation reached another record high in June, rising by 8.6% year-on-year. This is higher than analysts' expectations, who predicted a rise of 8.4%. Inflation is therefore continuing to rise, so the expectation that the ECB could raise rates by more than 0.25% in July is on target and this could support the euro's growth. On the other hand, there is a strong dollar which could continue to slow down bulls on the euro.
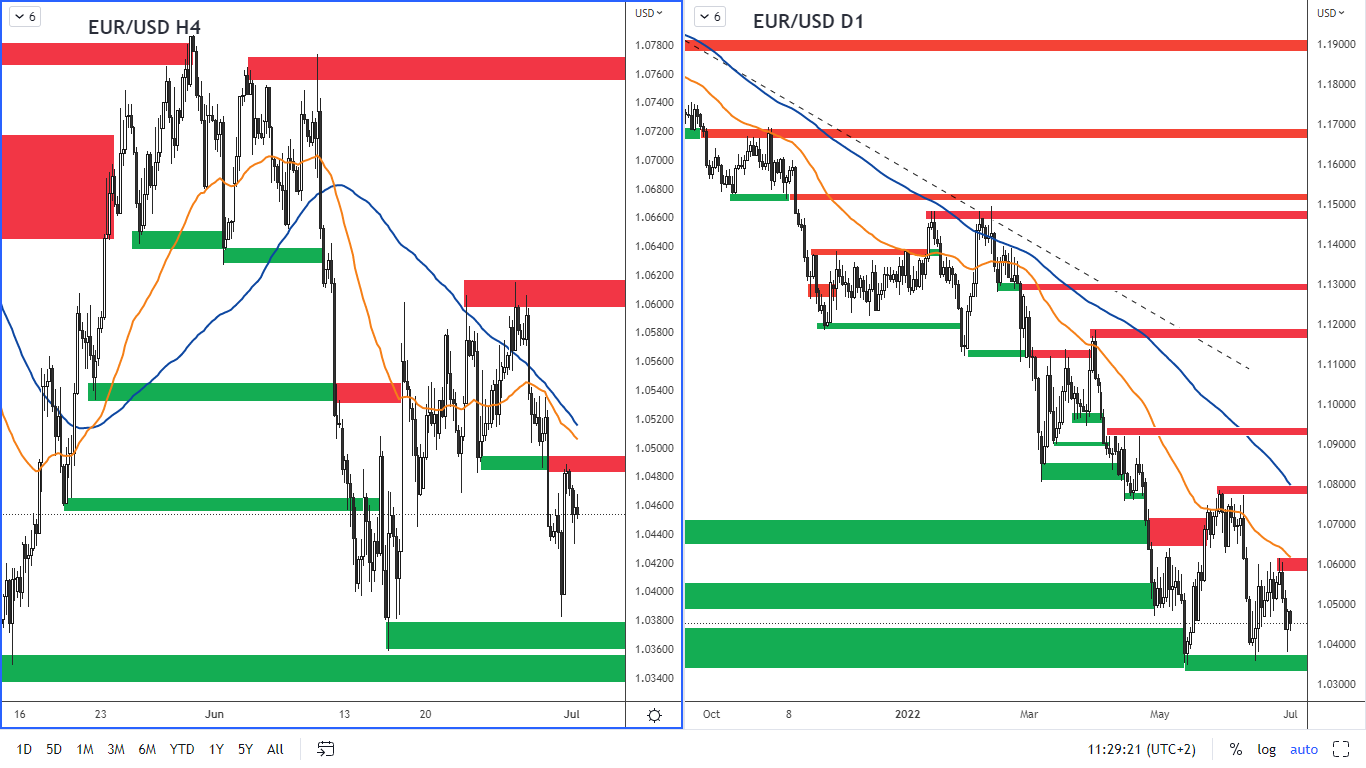
Figure 4: EUR/USD on H4 and daily chart
The nearest resistance according to the H4 chart is at 1.048 - 1.0500. The next resistance is at 1.0600 - 1.0610. Support is at 1.0360 - 1.0380.
Gold broke the $1,800 price tag
The development in gold has once again confirmed that investors prefer US bonds instead of gold, which, in addition to being considered a "safe haven" along with the US dollar, also brings a small but still certain return. The strong dollar is not good news for gold, which has fallen below the key support of USD 1,800 per ounce.
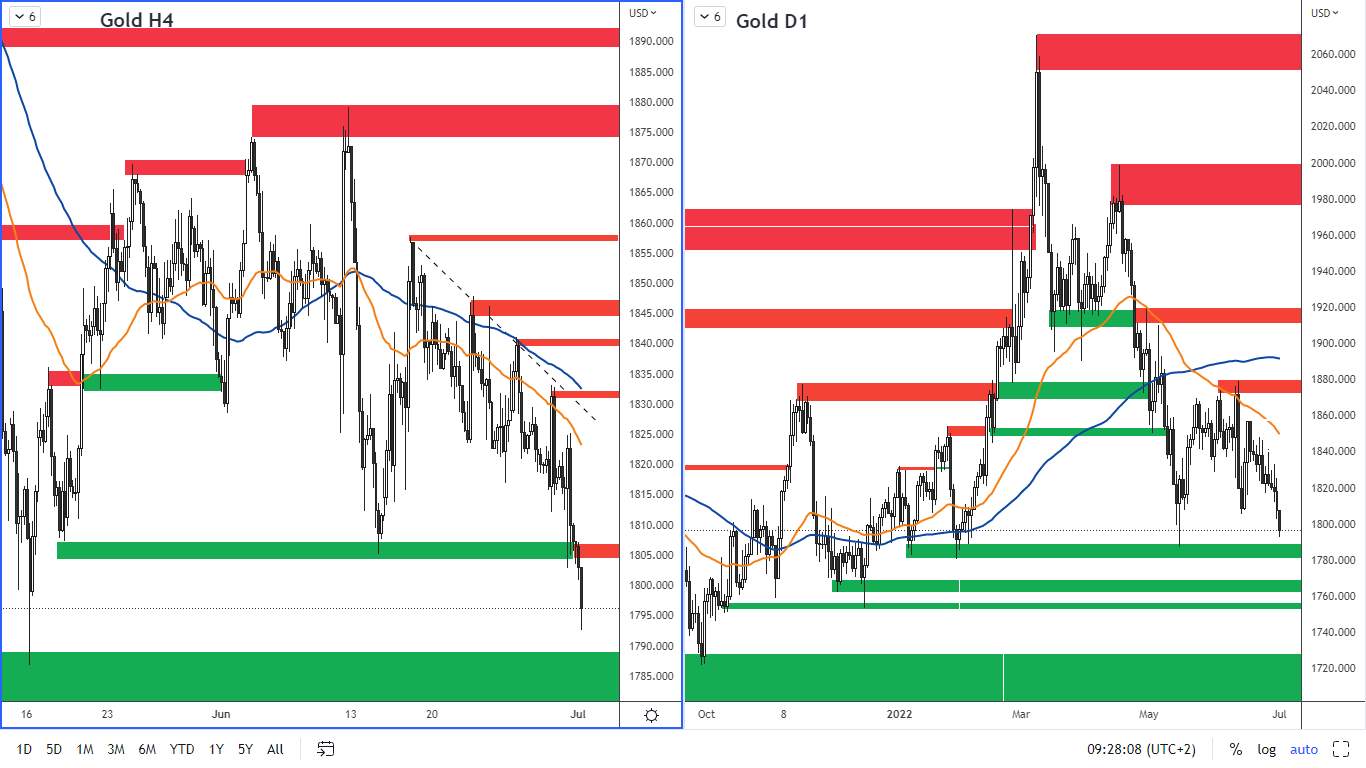
Figure 5: Gold on H4 and daily chart
The nearest resistance according to the H4 chart is therefore in the zone of USD 1,800 - 1,807 per ounce. Below this resistance we have several supports. The closest one is 1 780 - 1 787 USD per ounce.