The Swing Overview – Week 21
The markets remain volatile and fragile, as shown by the VIX fear index, which has again surpassed the level 30 points. However, equity indices are at interesting supports and there could be some short-term recovery. The euro has bounced off its support in anticipation of tighter monetary policy and the gold is holding its price tag above $1,800 per troy ounce. Is the gold back in investors' favor again?
Macroeconomic data
The news of the week was the FOMC meeting minutes, which showed that while the Fed is set to raise rates by 0.50% in June and July, it also hinted that there could be a pause in rate hikes later this year. This brought some relief to the markets and the indices started to rise. Some analysts believe that conditions are already tight enough. Still, it would be a mistake to interpret the rise in the markets in recent days as a restart of the bullish market. The main fundamentals that are having a negative impact on markets are still ongoing: the war in Ukraine, problems in logistics chains, high inflation and the lockdown in China due to zero tolerance for Covid-19.
There are also signs that the Fed's aggressive actions may already be slowing economic growth. The GDP for 1Q 2022 fell 1.5%. But this is not a confirmed recession yet. The manufacturing PMI also showed a decline in activity. Although it came in at 57.5 for May, which is as expected, it is lower than in previous month when it was 59,2.
The labor market remains tight and therefore the number of unemployment claims showed a decrease by 8 thousand from the previous week, reaching 210 thousand claims, which is an appropriate level.
Last week saw a continuing decline in US Treasury yields, which were recently above 3% and are now in the region of 2.6%. Along with this, the US dollar also weakened. Overall, there has been an easing of tensions in the markets.
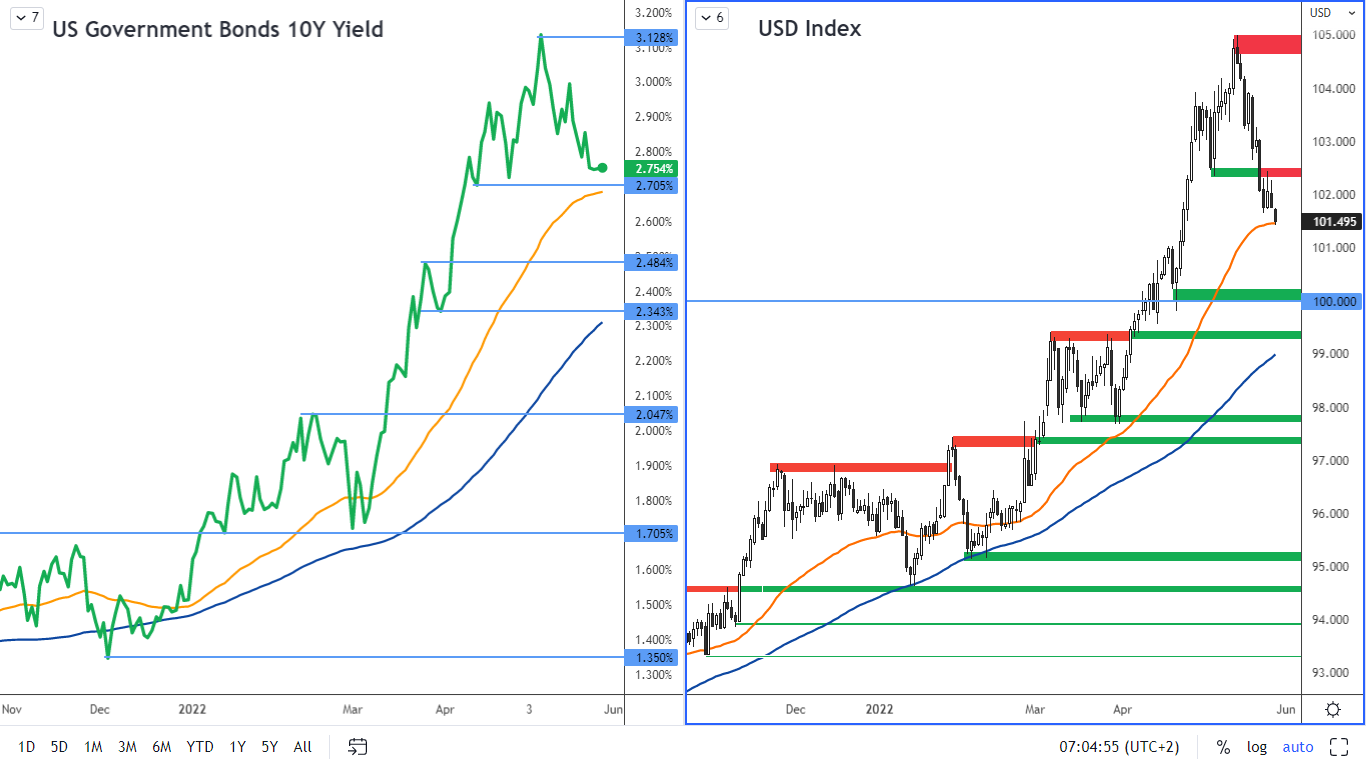
Figure 1: US 10-year bond yields and USD index on a daily chart
Equity indices have approached resistance
The relief in the markets after the release of the FOMC report was reflected in the equity indices, which bounced off their supports and started to rise. However, from a technical perspective, they are still in a downtrend, which means that the rise we have seen over the past week could be just a temporary correction.
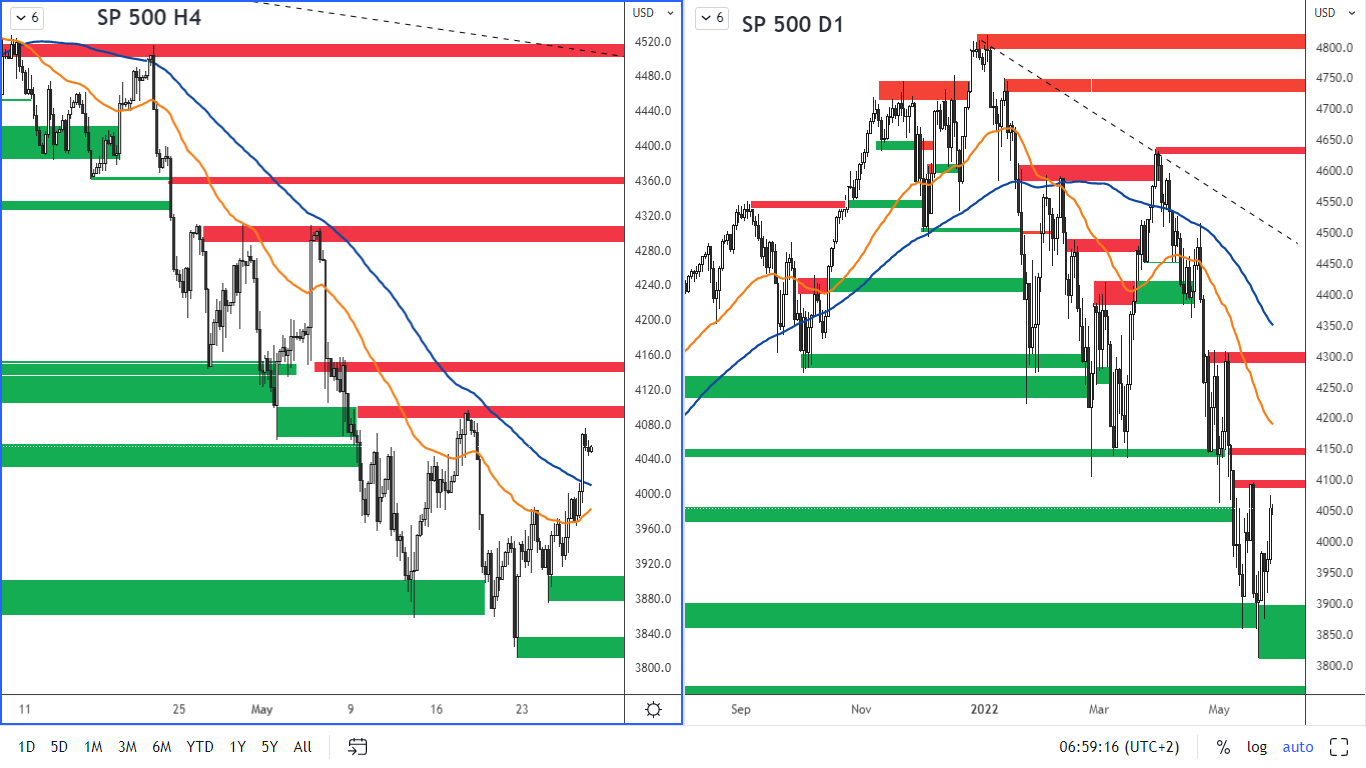 Figure 2: The SP 500 on H4 and D1 chart
The US SP 500 index is approaching a significant resistance level, which is in the 4,080 - 4,100 range. The next one is at 4,140 and especially at 4,293 - 4,300. Support is at 3 860 - 3 900.
German DAX index
The German Ifo business climate index, which shows managers' expectations for the next 6 months, pointed to optimism, with a reading of 93 for May, an improvement in the previous month when the index was at 91.5. The manufacturing PMI for May came in at 54.7 (up from 54.6 in April), also indicating an optimistic outlook.
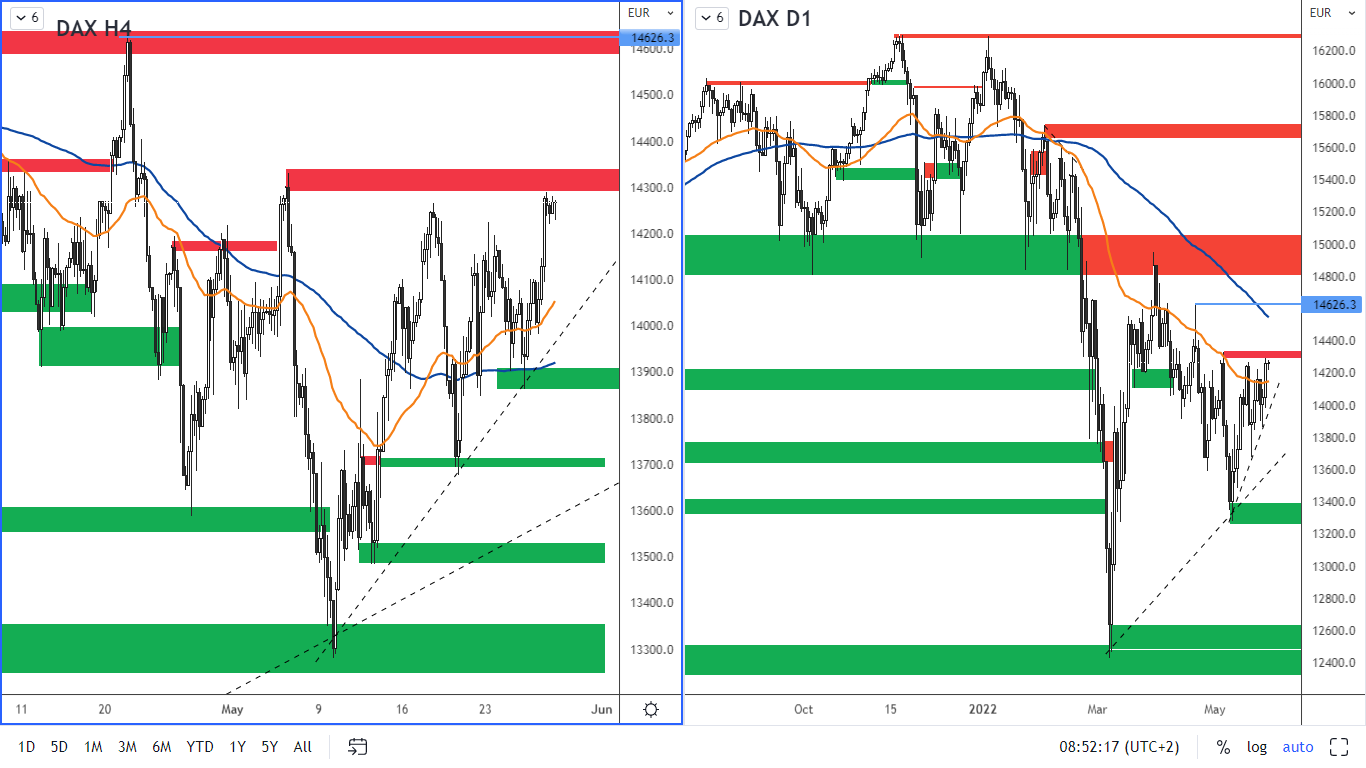 Figure 3: German DAX index on H4 and daily chart
The DAX has reached resistance in the 14,290 - 14,340 area. The nearest significant support is at 13,860 - 13,910. On the H4 chart, the EMA 50 moving average has got above the SMA 100, which is a bullish signal. An uptrend line has also formed, which could provide support for temporary growth. However, from the daily chart, there is still clear downtrend.
Euro in a bullish mood?
The euro benefited from the weakening of the dollar and continued its bullish correction. Partly under the influence of the expected rate hike that could come in July.
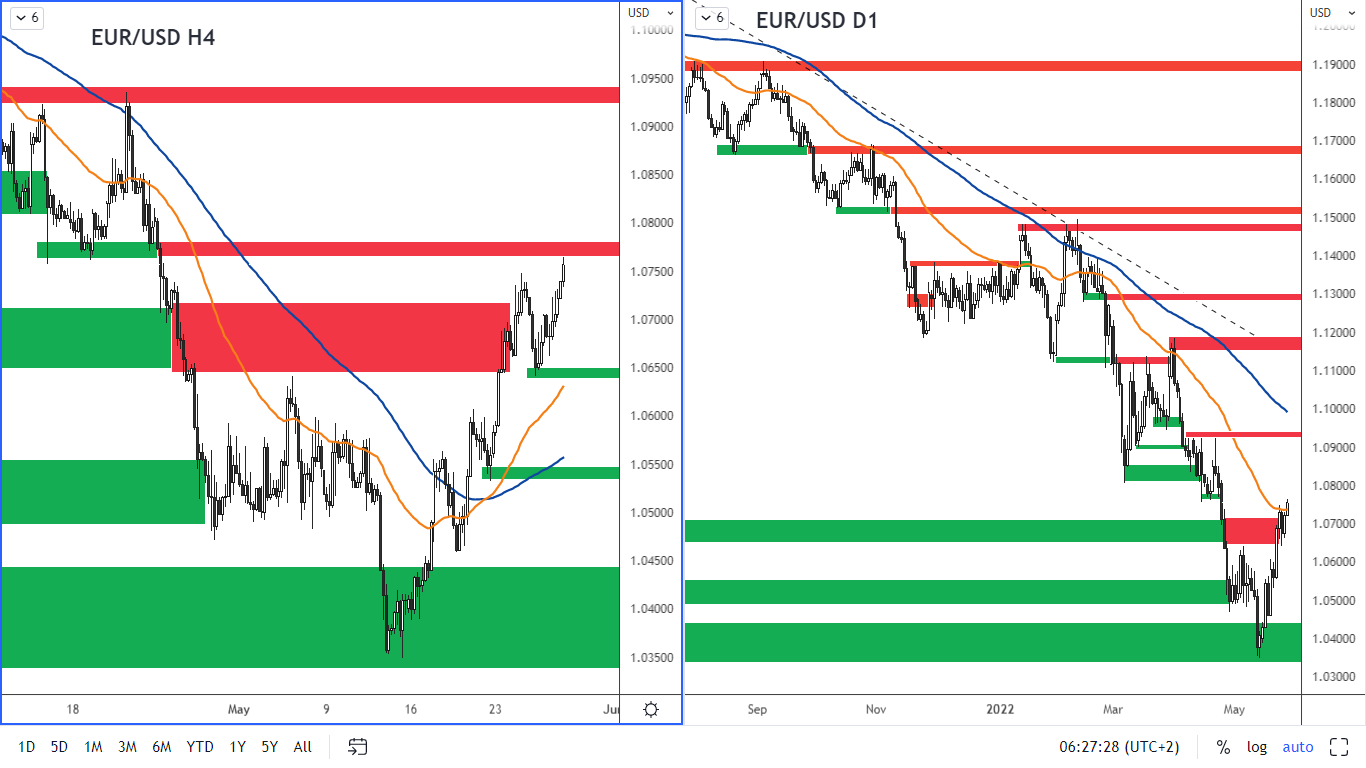
Figure 4: The EURUSD on H4 and daily chart
The currency pair broke the resistance at the 1.07 level and approached the resistance at the 1.076 - 1.0780 level, which is also at the EMA 50 moving average according to the D1 chart. The nearest support is now at 1.0640 - 1.0650 and further at 1.0540 - 1.0550.
Will the gold get to 1900 level?
The decline in the US dollar is also positive for gold. In addition, the gold is also supported by high inflation.
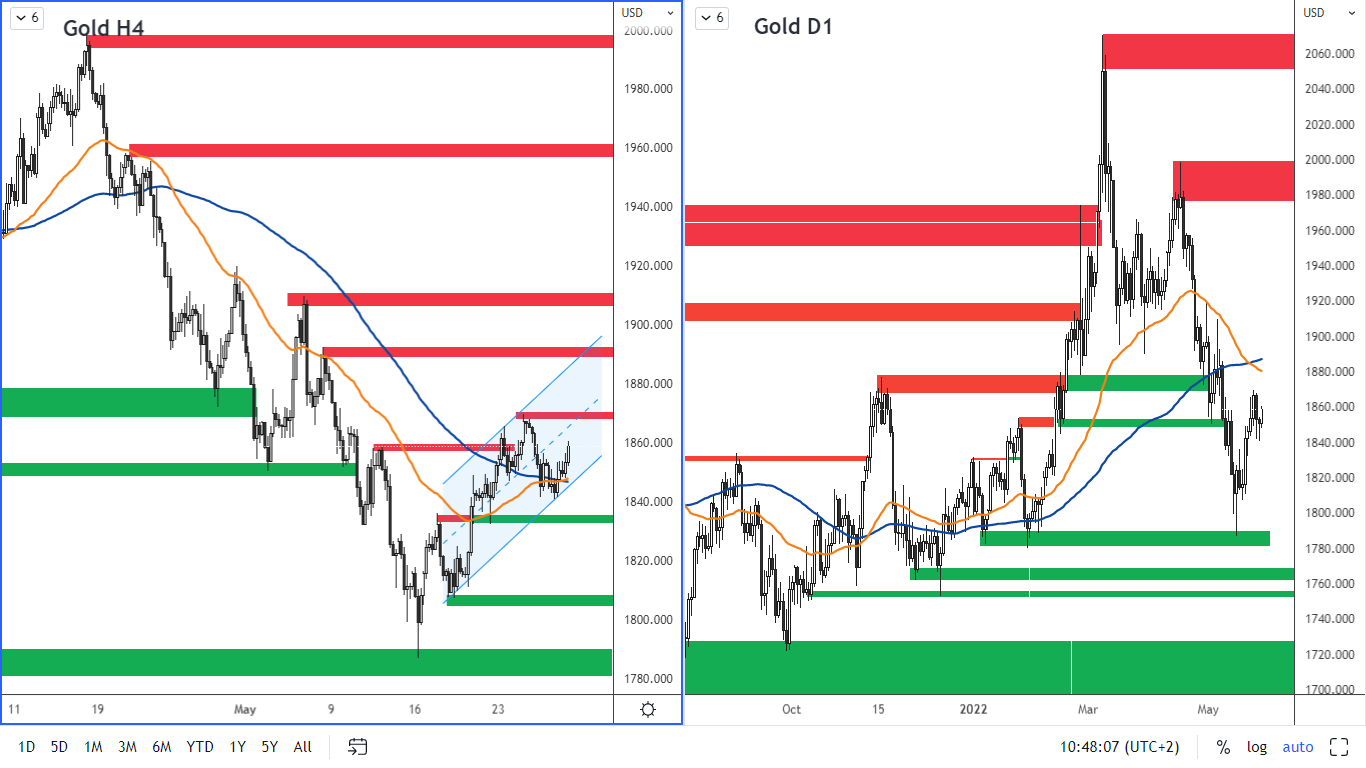 Figure 5: The gold on H4 and daily chart
From a technical perspective on the H4 chart, we can see that the yellow metal is moving in a rising channel. This could of course be a mere correction in the downtrend but we can also see that on the H4 chart the price is above the SMA 100 moving average and also the EMA 50 is now above the SMA 100. These could indicate further strengthening at least to the next resistance levels.
The first resistance level is at $1,868 - $1,870 per ounce. The next resistance level is at $1,888 - $1,890 per ounce. Support is at 1 833 - 1 840 USD per ounce. The next support is at USD 1 805 - 1 807 and especially USD 1 800 per ounce.