66.30 % of retail investors lose their capital when trading CFDs with this provider.

CFDs are complex instruments and come with a high risk of losing money rapidly due to leverage. 66.30 % of retail investors lose their capital when trading CFDs with this provider. You should consider whether you understand how CFDs work and whether you can afford to take the high risk of losing your money.

Technical analysis - basic methods and principles

Published: 17.10.2023

Technical analysis allows you to gain a better insight into what is happening on the price chart and to identify an emerging trading opportunity in time. In addition, it is relatively simple to learn, which makes it a must-have for every beginner trader. In this article, we will cover its basics.

Although the foundations of this approach to analyzing markets go back more than 100 years, technical analysis is still an indispensable part of trading today. While the technical analysis does not provide a guaranteed recipe for success (nothing does), it does significantly tip the scales of statistical probability of profit in the trader's favor.
 
So today, we will look at the basic methods and principles of technical analysis that will help you learn to find potential trading opportunities in charts, and we will discuss the basic tools that technical analysis uses.
 

What is technical analysis?

Technical analysis is a method of examining financial markets and estimating potential price movements within them. It is based on historical market data and tries to predict future price movements. Traders using technical analysis can trade stocks, Forex, commodities, and any other trading instruments and can choose many strategies for this purpose.

In fact, technical analysis can be performed either on a pure chart using so-called price action or with the help of various indicators and support programs. Although it is not the only way of analyzing financial markets, technical analysis is used to some extent by retail and leisure traders as well as full-time traders and professionals. Thus, knowledge of technical analysis should be in the skillset of every trader.

Why trade with technical analysis


There are several reasons to get started with technical analysis, but the main ones include the following.
 

Relative simplicity

Compared to other analytical approaches to financial markets, technical analysis is relatively simple and quick to learn. It often does not require any paid programs or information resources, and you can find plenty of free educational materials on the internet. Thanks to technical analysis, you can start trading in just a few weeks and gradually improve your skills.
 

Versatility

Technical analysis can be used for virtually any type of market from Forex, stock indices, equities, and commodities to cryptocurrencies. You can also use it for scalping, intraday, or swing trading strategies.


Mitigating emotions when trading

Trading is psychologically a very strenuous discipline. Emotions such as greed or outright fear can significantly impair the trading results of traders, and traders who open more and more trades in an attempt to mitigate mounting losses often end up with an empty trading account. Technical analysis helps in this regard in part because it is oriented towards objective numerical data and, when combined with the right tools, can bring true objectivity to trading.
 

Technical vs Fundamental Analysis

While technical analysis focuses on historical data from the markets to make predictions about possible future developments, fundamental analysis focuses on various financial, economic, and business reports, as well as current geopolitical events and even the weather. Fundamental analysis takes a more holistic approach to markets. It examines so-called fundamental factors and indicators. These influence the possible future price of traded assets.

The economic calendar is an essential tool for fundamental traders. It shows chronologically ordered events (fundamentals) that may have a certain impact on the markets.

So if you are trading oil, you will find the weather mentioned above among the fundamental indicators (seasonal hurricanes in the US tend to damage the oil wells there, which then translates into the price of US WTI crude oil). Fundamental analysis is a more advanced tool that most traders come to gradually.
 
For a beginning trader who wants to specialize in technical analysis, it pays to follow fundamentals to the extent that he or she knows when, for example, central bank meetings or other major market events are about to occur, during which markets can be highly unpredictable.
 

What technical analysis tracks in charts

Trends

This is the longer-term direction of movement of a particular instrument or market. This can be either upward (bullish) or downward (bearish). We can recognize rising trends by the price on the chart reaching a series of higher highs and lower lows. One of the most basic lessons of trading is that the trend is your friend. This is because successfully identifying the emergence of a trend and then trading it is the goal of perhaps every trader.  The principle is to always trade in the direction of the trend.
 

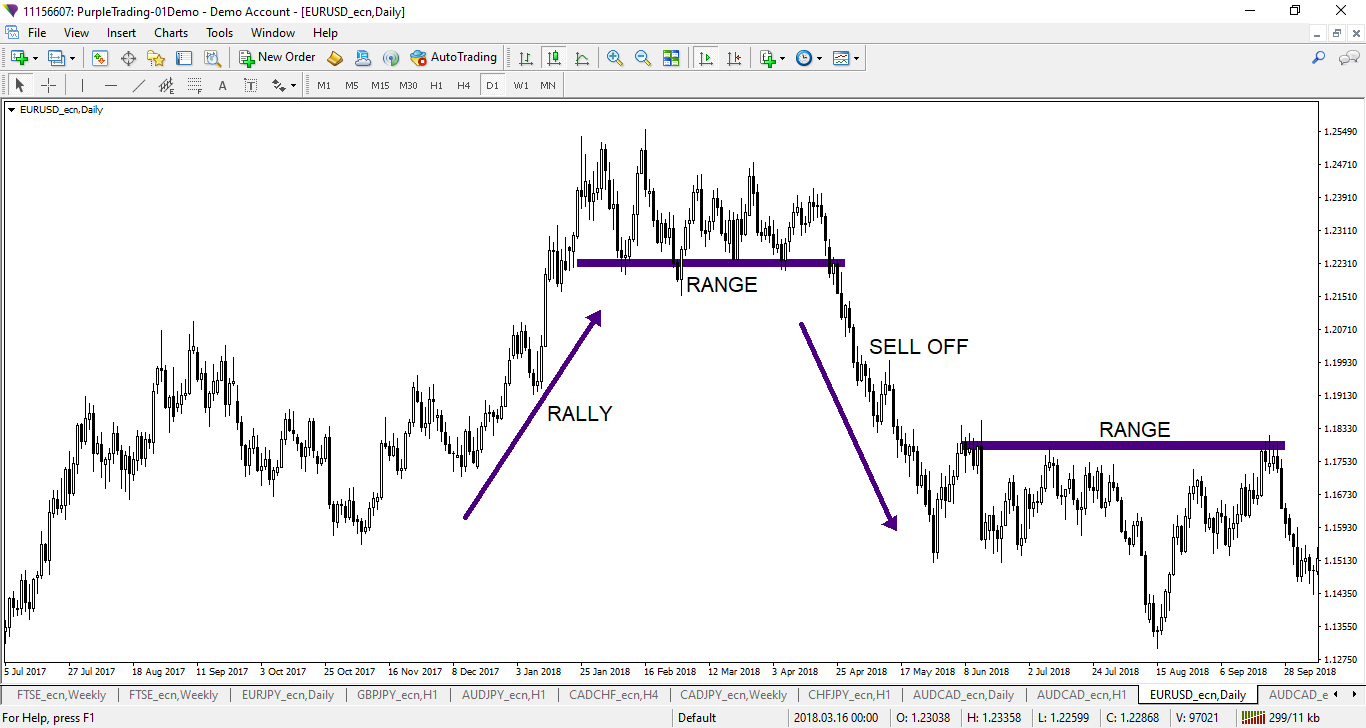
Chart 1: Example of a sharp uptrend, sideways trend, and sell-off on the EURUSD pair


S/R zones

In full, support/resistance zones are significant price levels on the price chart where the price is expected to react in a certain way. For support zones or levels (a zone contains a larger range of prices, a level is a specific price), a falling chart usually tends to stall and then usually bounce. Sometimes, however, a breakout occurs. Resistance zones/levels, on the other hand, tend to slow or reverse a falling price.
 
S/R zones are a very useful tool for traders as they help them to identify suitable places to enter the market, i.e. open a trading position. The formation of S/R zones depends to a high degree on the psychology of the market and the distribution of forces between sellers and buyers.


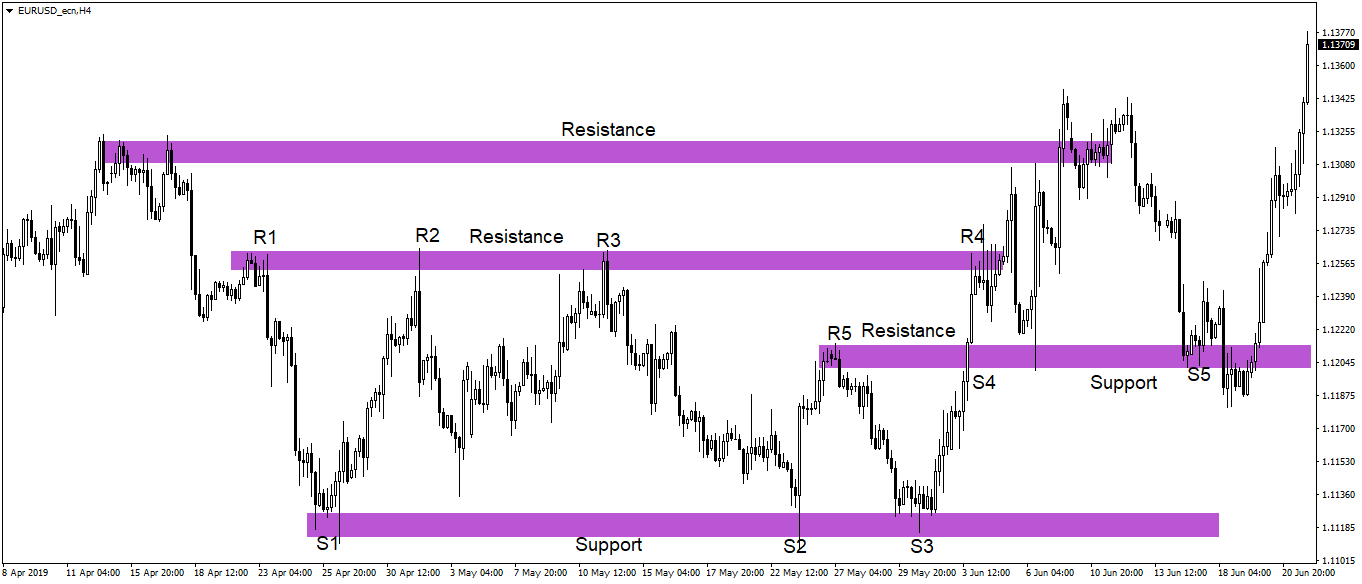
Chart 2: Example of S/R zones on the EURUSD currency pair
 

Candlestick formations

Trading platforms, through which traders watch charts and then execute trades, allow charts to be displayed in several different ways. One of the most common ones, however, is the so-called candlestick chart. This shows the price in the form of candles, where each candle represents the movement of the price of an instrument per unit of time (on a 30-minute chart, 1 candle will correspond to the price movement over 30 minutes, etc.).
 
Depending on the color of the candle or the size of its body or wick, traders can then determine whether the market was dominated by sellers or buyers over a period of time, what the maximum and minimum price of the instrument was, or what the distance was between the opening and closing price.
 
The candles form so-called candle formations. A candle formation is a price movement that is expressed graphically by candles, on the basis of which the future development can be predicted with a certain probability.  Some formations are formed by one candle, some by two or more candles. Candle formations can be reversal formations, i.e. they signal a reversal of the trend, or continuous formations, where they will indicate a continuation of the trend.  There are many formations and below you will find at least a few of them.

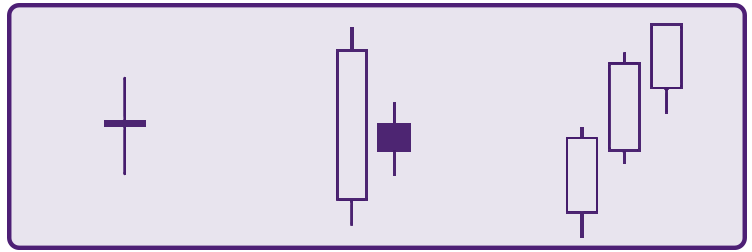
Figure 1: Candle formations can consist of one, two, three, or more candles (from left to right: doji; bear harami; three white soldiers). In this case, a white candle indicates a rising price, a black one a falling price.
 

Price Action - an integral part of technical analysis

Price action works primarily with trend lines, S/R zones and candle formations. This is a very popular discipline within technical analysis. Price action focuses purely on the price of the instrument being traded and the patterns (or patterns) that the price - displayed by various chart types - forms. Thus, traders using price action trading strategies do not use any supporting programs or technical indicators. For this reason, price action is traded only from a clean chart.
 
Price action, like technical analysis, can be used for any type of market and is an excellent tool, especially when combined with other technical analysis tools, which we will now discuss.
 

Technical analysis tools

Although technical analysis can only be traded from a clean chart using price action, a large number of traders like to base their decisions on technical analysis tools. These are mathematical and statistical tools that use historical prices, volumes, and other market information. Technical analysis tools visualize the data into a price chart, which can help experienced traders get a better view of market trends or important S/R levels, and thus better time their entry into the market.
 
Technical analysis tools include countless types of indicators, oscillators, and other models, we'll briefly mention these 4 today:
 

  • Moving Averages
  • MACD (Moving Average Convergence Divergence)
  • RSI (Relative Strength Index)
  • Fibonacci Retracement


Moving averages

One of the most commonly used technical analysis indicators. It is used to "smooth" the price of an instrument - it averages prices over the last X periods. In the image below, you can see that while the price shown by the line chart (black) is choppy, the green moving average shows it more clearly. Moving averages can be arithmetic (simple) and exponential.

Chart 3: Arithmetic moving average on the EURUSD currency pair


MACD

This technical indicator measures the difference between two exponential moving averages, which it then displays using a histogram at the bottom of the price chart. The MACD is an excellent tool for signaling a change in trend.
 

RSI (Relative Strength Index)

Helps to identify overbought and oversold areas of the selected instrument. The indicator ranges from 0 to 100. If the value of the indicator reaches 70 and above, the market is overbought and it is possible that it will turn downwards. If the indicator value is below 30, the market is oversold and an upward reversal may occur. Our Purple Bands indicator also works similarly to the RSI, but with the difference that it is much more user-friendly and suitable for novice traders.
 

Fibonacci retracement

This tool is based on the idea that prices will often repeat a predictable portion of a move, after which they will continue to move in the original direction. Fibonacci retracement levels are calculated using Fibonacci sequence ratios. The most commonly used ratios are 3.6%, 38.2%, 50%, 61.8% and 100%.
 

Key terms

Candlestick patterns
Show answer
Candlestick patterns consist of one or more candles. Most candlestick formations consist of a maximum of five candles. They are used for short-term predictions of price movements or serve as confirmation for trade entry.
Forex
Show answer
Forex is a global market on which currency pairs are traded. The name Forex is derived from Foreign Exchange. The Forex market is the largest and therefore one of the most liquid markets in the world.
Price action
Show answer
Price action is a method of technical analysis that is based on observing a price chart without any indicators. It uses candle and price formations, market structure, horizontal supports and resistances and possibly trend lines.
Resistance
Show answer
Border of “resistance” visible in the chart. It forms in the space where bid (supply) is higher than ask (demand) while the price doesn’t jump over this level and keeps bouncing back down off of it.
Reverse price patterns
Show answer
Reverse formations signal a reversal of the current trend. The current trend will stop after some time, a consolidation will occur and then a new trend will start. A reverse formation that forms at the top of a move is called a distribution, where active selling of the instrument occurs. On the other hand, the formation that forms at the lower levels is accumulation, which is the area where active purchases will occur.
Support
Show answer
Border of “support” visible in the chart. It forms in the spaces where ask (demand) is higher than bid (supply) while the price doesn’t fall beneath this level and keeps bouncing back up off of it.
66.30 % of retail investors lose their capital when trading CFDs with this provider.

CFDs are complex instruments and come with a high risk of losing money rapidly due to leverage. 66.30 % of retail investors lose their capital when trading CFDs with this provider. You should consider whether you understand how CFDs work and whether you can afford to take the high risk of losing your money.