66.30 % of retail investors lose their capital when trading CFDs with this provider.

CFDs are complex instruments and come with a high risk of losing money rapidly due to leverage. 66.30 % of retail investors lose their capital when trading CFDs with this provider. You should consider whether you understand how CFDs work and whether you can afford to take the high risk of losing your money.

Trading Trends 2023 - Smart Money Strategy and Trading with Order Blocks

Published: 04.12.2023

In December, we'll take a look at the biggest trading trends for 2023. And we'll start with the smart money trading method, which was one of the most popular this year.

The smart money strategy, which is hugely popular among advanced traders, follows the trail left behind by the so-called big players in the market. One of these traces is a formation known as an order block. We will discuss how and why these blocks are formed in today's article. At the same time, we will show you the basics of an advanced trading strategy with the help of which you can manage order blocks effectively.

What is Order Block (OB)

Order Blocks (hereafter referred to as "OBs") are groupings of orders at a specific price level that are located throughout the price chart and on different time frames. Smart Money's trading strategy works with these blocks and as such they represent a large volume of positions and cause impulsive price movement. In other words, an order block in forex refers to specific price levels of supply or demand at which major market participants have placed their orders and initiated large moves.
 

For the purpose of trading OBs and identifying them in the chart, the following definition can be used:

Bearish order block

  • The last bullish candle made the highest high, before the next decline.
  • Confirmation: A bearish order block is confirmed when it is followed by an impulsive move that shows up on the chart as a Price Value Gap.

Bullish Order Block

  • Definition: The last bearish candle that has formed the lowest low before the following upward movement.
  • Confirmation: A bullish order block is confirmed when it is followed by an impulsive move that shows up on the chart as a Price Value Gap.

The requirements of the highest high for a bearish OB and the lowest low for a bullish OB are one variation. Any last opposite candle before the following impulsive move can also be considered an OB. The trader should try both variants himself to understand which OB gives him better results.
 

Why do order blocks work?

Large banks and institutions (big players) that have huge amounts of funds at their disposal cannot place all their orders at one time. If they did, rapid movement would occur and these institutions would then be unable to fill their orders at a price that is favorable to them. Therefore, they place their orders in the market gradually. The market often sees these areas as consolidation.

Once the orders are ready, they trigger an impulsive move, which they often use various fundamental news to do. Within that impulsive move, several scenarios can then occur. One is that not all orders were filled during the impulsive move and therefore price reverts back to those order blocks.

This return to the order block level is due to the need to balance supply and demand. This is because during a rapid move, an imbalance will occur, which shows up on the chart as a Price Value Gap (or imbalance), and the price will return to the order block to bring the market into balance. Only then will the price continue the movement created by the order block.
 

Where can I find order blocks?

Order blocks can be found on any time frame, from minutes to weeks, and can be used in any market, including stocks, futures, forex, and cryptocurrencies. Trading with order blocks can be combined with other technical analysis methods such as trend lines, moving averages, oscillators or candlestick formations. They can be used to confirm trades or to identify potential stop loss and take profit trade setups.

How to recognize an order block on a chart trading platform

As we have already mentioned, an order block is the last reversal candle before a strong move that creates an imbalance in the market. Price is likely to return to these zones before triggering another impulsive move to continue its trend.
 

How to recognize a bear order block

According to the variant where the last highest bullish candle formed before the downward movement is considered to be a bearish OB, such a candle would be candle 1.

Bear OB
Bearish order blok


If we consider the OB to be the last bullish candle before the strong downward move, then it is candle A. We consider the OB to be the size of the whole candle. The impulsiveness of the move is confirmed by the Price Value Gap.
 

How to recognize a bullish order block

At point A is the last bearish candle before the next strong bullish move. The price then quickly moved upwards, which is confirmed by the Price Value gaps. We consider this entire candle to be an OB.

Bullish order block
Bullish order blok


A possible option is to consider the last bearish candle that was the lowest before the impulsive move (candle #1) as a bullish OB.

Ebook: How to trade Forex

In this ebook you will find explanation of basic terms and concepts in Forex trading, demonstrations of basic price formations on a chart and how to trade them, recommendations for appropriate trading support tools and much more!

You need to find a valid demand/offer area

  1. You need to find a valid demand/offer area

    A valid supply/demand area is where prices are rising (or falling) rapidly and breaking the structure (BOS). Thus, in the case of an uptrend, it creates a break of the previous high (resistance becomes support), in the case of a downtrend, it creates a break of the previous low (support becomes resistance).

    Alternatively, the second case is possible, when a change of character (CHOCH) occurs. Thus, in an uptrend a higher low will be broken and in a downtrend a lower high will be broken.

    Break in structure (BOS) and change in structure (CHOCH)
    Break in structure (BOS) and change in structure (CHOCH)

     
  2. The breakthrough must be valid

    Examples of valid and invalid breakthroughs are shown in the next figure:

    Examples of valid and invalid breakthroughs

    Examples of valid and invalid breakthroughs


    The figure shows a break with bearish candles. The analogous procedure is in the case of bullish candles with the difference that it is a resistance break. Practically, the idea is that the break of support or resistance is confirmed by the body of the candle, i.e. not by its mere wick.

  3. The movement must be unbalanced (impulsive)

    An imbalanced movement is signalled in the chart by the Price Value Gap. This gap signals impulsiveness. In the next picture, there is a bullish OB (candle A) and the blue rectangles show the Price Value Gaps. It can be seen that the price is quickly moving away from the OB.

    Price Value Gaps occur between three candles and it is a situation where the wicks of the first and third candle do not touch or overlap.


    Imbalances following OB

    Imbalances following OB
     

    We consider these OBs that have generated impulsive movement as valid and try to search for them in the graph.

    The next figure shows a bear OB with an imbalance motion.


    Balanced movement, no signs of impulsiveness

    Balanced movement, no signs of impulsiveness
     

    Candle A is the last highest bullish candle before the next decline. However, in this case, the candles overlap, there are no Price Value Gaps, the prices form a balance, so there is no sign of impulsiveness. Order blocks that form in a balanced move are better not to be taken.

Practical demonstration of using order block in trading

We will demonstrate the use of OB on the currency pair USDJPY, which is shown in the following picture:

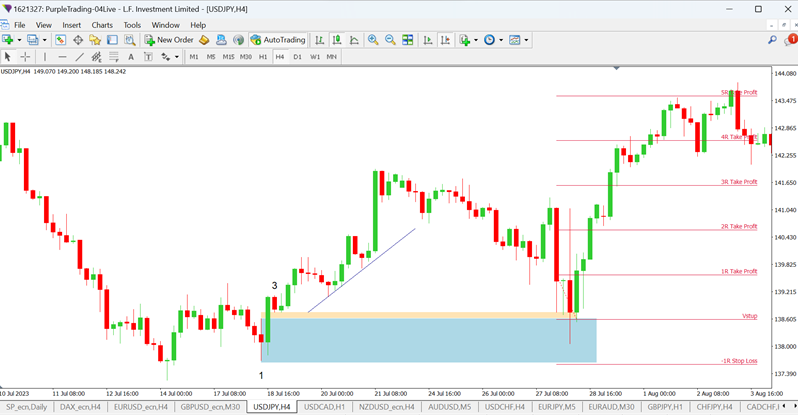
Bullish OB on the USDJPY pair on the H4 chart

There is a bullish OB at point 1. It is the last bearish candle before the next upward move, which marks the rising trend line. A Price Value Gap has formed between candle number 1 and number 3. The OB is therefore valid. Then we wait for the price to return to this OB. After that, the entry is in the long direction.

In the next picture we have an example of a bearish OB in a downtrend situation:

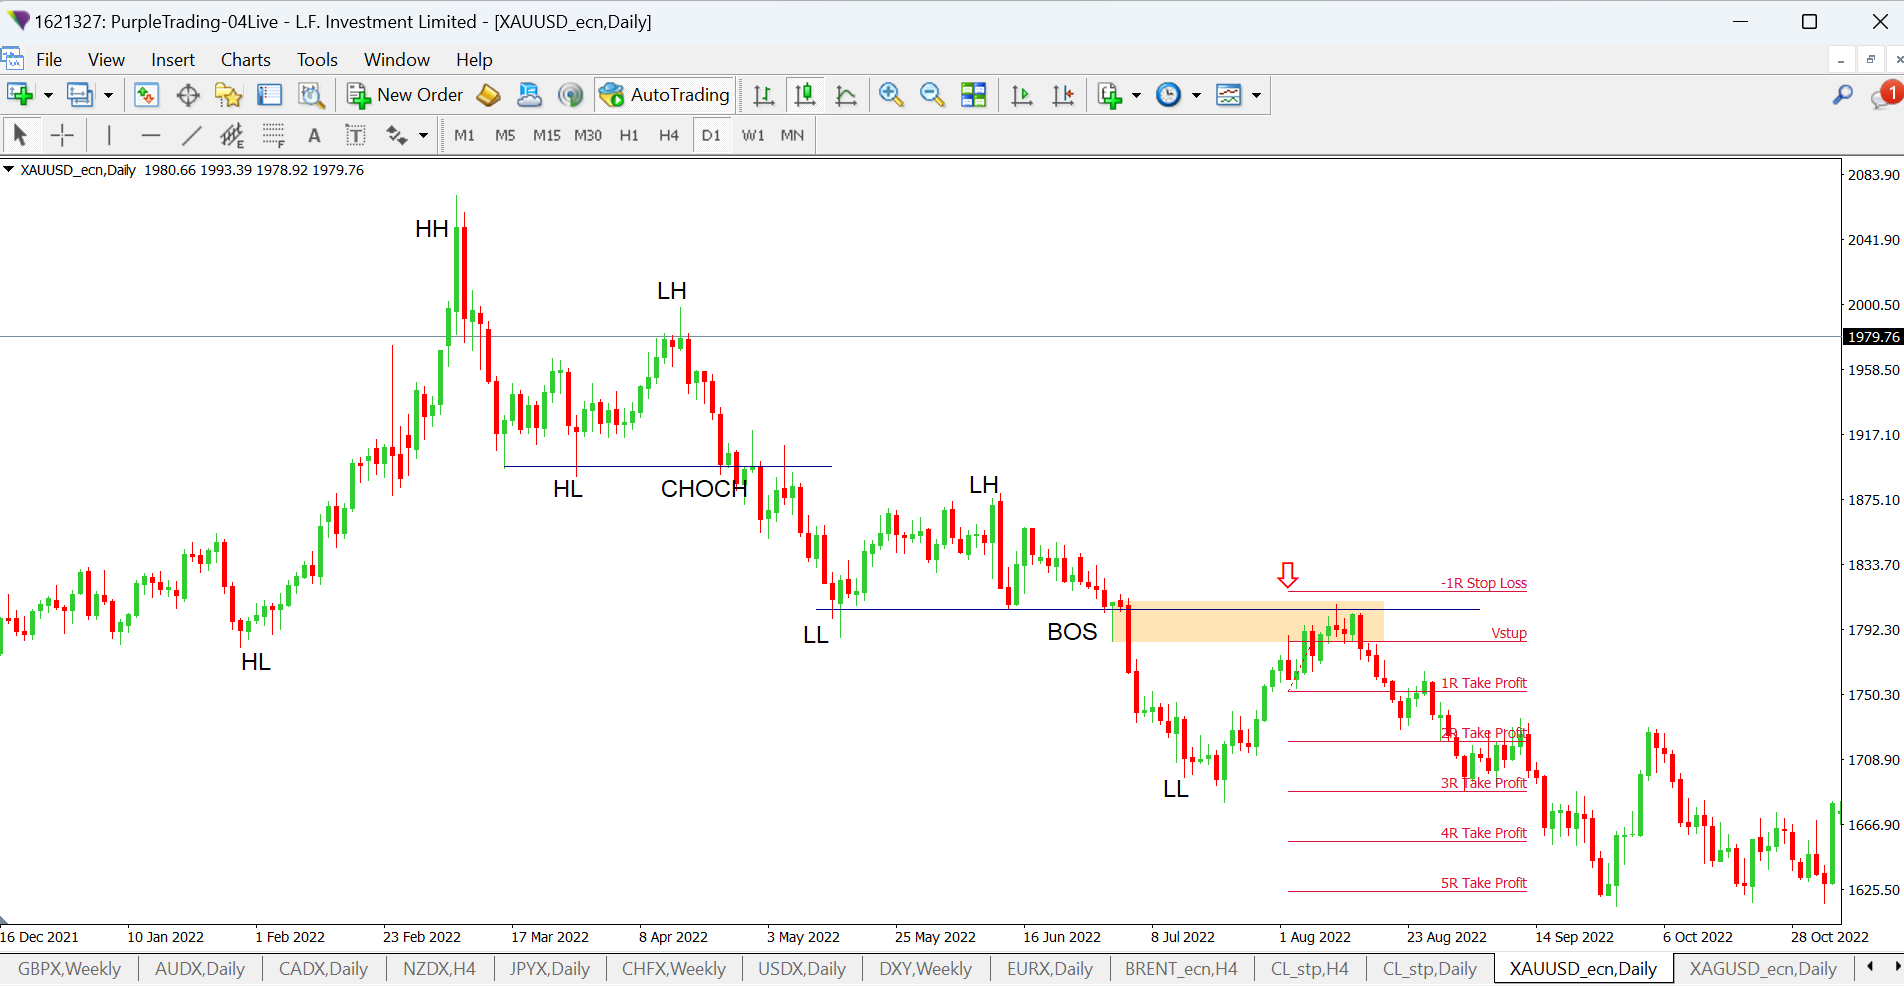
Gold on D1 chart (HH-higher high, LL- lower low, HL- higher low, LH - lower high)


Gold has formed a lower low (LL) and a lower high (LH). There was a break of the lower low (BOS) and a bearish order block (last bullish candle before the breakout) was formed at this point. This break was also accompanied by a Price Value Gap. Price later returned to the order block and would have offered a trade with 3R potential if we had speculated to the previous LL.

Note on entry

The figure shows that the entry was virtually the moment price touched the OB boundary. However, since the Price Value Gap was not completely filled, this is a disadvantageous and even risky entry because the Price Value Gap represents a gap that tends to fill.

To take advantage of the signal using OB, it will be more appropriate to wait for the Price Value Gap to be filled, which is close to OB. This will happen if the OB is not part of the Price Value Gap (i.e. its first candle). Once the Price Value Gap is filled, you will move to a lower timeframe, on which you will then look for some confirming candle formation to indicate a move in the expected direction.

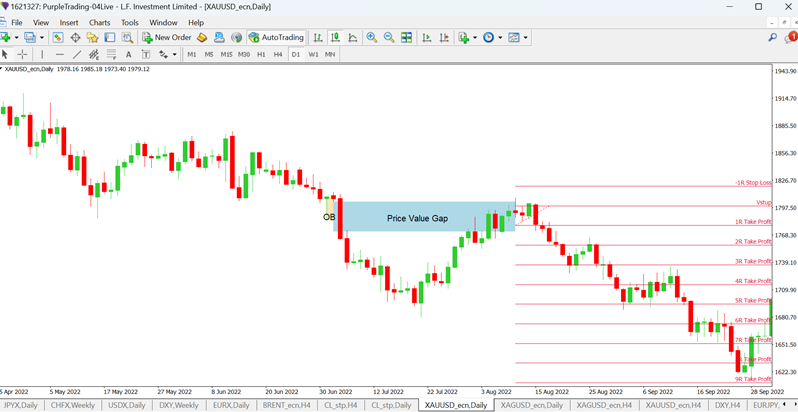
Entry after filling the Price Value Gap


In this case, the trade would offer patient traders a profit of almost 6R if the entry was made after the Price Value Gap was filled.

7 tips for easier identification of order blocks

  1. Analysis on a higher time frame

    Start by analyzing charts on a higher time frame, such as daily, weekly or monthly, to identify significant price levels where a BOS or CHOCH has occurred. These levels are often where institutional orders are expected to be placed.

  2. Zones of consolidation

    Before a strong move, price usually consolidates.
  3. Finding order blocks

    Once support and resistance levels are identified, look for order blocks ahead of strong Price Value Gaps.

    Identify the last bearish candle before a strong upward move or the last bullish candle before a bearish move.

  4. OB Confirmation

    Verify the validity of the OB and the overall market context. Trading OBs that are countertrend are a risky option. It is preferable to trade in the direction of the identified trend.
  5. Retest OB

    Once an order block has been identified, wait for price to return and retest the area. Here traders expect institutions to be interested in entering the market. Prefer only untested OB. If the OB has an unfilled Price Value Gap, wait for it to be filled.
  6. Confirmation by price action

    To confirm entry, move to a lower timeframe (for example, from D1 to H4, from H4 to H1 and from H1 to 15min) and look for confirmation using a candle formation such as pin bars, engulf or doji. These formations can give higher assurance as to the correctness of the direction of the next move. However, sometimes they can worsen the Risk Reward Ratio.
  7. Watch out for fundamentals

    Keep in mind that OBs can be disrupted by significant fundamental news or events. So find out what fundamental events are on the calendar. This is especially true if you are an intraday trader.

Boost your trading knowledge with Purple Academy!

Successful trader never stops learning. That is why we have created the Purple Academy where you can find interesting articles, knowledge-expanding ebooks and detailed trading turorials. So if you are interested, just dive in and start learning! (It’s free).

Risks of using order blocks

Identifying actual order blocks takes practice and can often be subjective. The risk is that institutional traders may change their strategies, invalidating previous order blocks. Unfortunately, as retail traders, we do not have the same information as institutional traders and the true motives of any large market player to move impulsively at any given time will never be clearly revealed to us.

As this strategy requires a certain amount of experience, backtest yourself using a demo account to see under what conditions you will use this strategy and on what time frame or instrument it will suit you best.

The order block trading strategy is an approach that aims to identify key support and resistance levels on price charts, referred to as "order blocks," and use them as potential entries or exits from trades. The basic idea is to assume that significant buying or selling by large institutions occurs at these levels, which influences future price movements.

Recommended articles

Key terms

Bearish / Bear market
Show answer
It is a designation for a falling market.
Bullish / Bull market
Show answer
It's a designation for a rising market.
Candlestick
Show answer
A graphical representation of the movement of the price change within the selected time frame. For example, a single candle on a daily time frame represents the price movement for one day. One candlestick on an hourly time frame represents the price movement over one hour. One candlestick shows open, close, high and low price within given time frame.
Candlestick patterns
Show answer
Candlestick patterns consist of one or more candles. Most candlestick formations consist of a maximum of five candles. They are used for short-term predictions of price movements or serve as confirmation for trade entry.
Fundamental analysis
Show answer
In fundamental analysis, the forex market is analyzed using macroeconomic data, social or political influences that can affect the demand for a given instrument.
Price action
Show answer
Price action is a method of technical analysis that is based on observing a price chart without any indicators. It uses candle and price formations, market structure, horizontal supports and resistances and possibly trend lines.
Resistance
Show answer
Border of “resistance” visible in the chart. It forms in the space where bid (supply) is higher than ask (demand) while the price doesn’t jump over this level and keeps bouncing back down off of it.
Risk Reward Ratio
Show answer
The Risk Reward Ratio (or RRR) compares the size of the amount planned to be risked with the planned gain. The planned amount at risk is determined by the stop loss setting, the planned profit is determined by the take profit setting. For trades that have already been executed, the RRR is often calculated as the ratio of the average risk to the average profit.
Support
Show answer
Border of “support” visible in the chart. It forms in the spaces where ask (demand) is higher than bid (supply) while the price doesn’t fall beneath this level and keeps bouncing back up off of it.
Technical analysis
Show answer
Technical analysis is a form of analysis where the trader examines the price. Charts are used for analysis to show the movement of the price. The assumption is that all the information is already contained in the price.
66.30 % of retail investors lose their capital when trading CFDs with this provider.

CFDs are complex instruments and come with a high risk of losing money rapidly due to leverage. 66.30 % of retail investors lose their capital when trading CFDs with this provider. You should consider whether you understand how CFDs work and whether you can afford to take the high risk of losing your money.