66.30 % of retail investors lose their capital when trading CFDs with this provider.

CFDs are complex instruments and come with a high risk of losing money rapidly due to leverage. 66.30 % of retail investors lose their capital when trading CFDs with this provider. You should consider whether you understand how CFDs work and whether you can afford to take the high risk of losing your money.

Trading Trends in 2023 - Smart Money Strategy and trading liquidity

Published: 14.12.2023

Smart Money trading has been really popular this year. That’s why we’re going to take a look at one of its techniques that helped traders make the most of opportunities in 2023.

In December, all of our articles will slightly touch on the theme of trends that have prevailed in trading this year. Since our data claims that Smart Money trading was the most popular approach of traders in 2023, we decided to dedicate two articles to it.

In addition to the already-written article on Smart Money and trading with order blocks, you can also look forward to an article from the world of alternative investments and many more at the beginning of the year. But for now, let's turn our attention to Smart Money trading and the liquidity trading (or withdrawal) technique that goes along with it.

Why is liquidity important?

Many traders don't realize that the price of the instrument they follow so closely doesn't move according to the indicators. Indicators are lagged and more or less serve the purpose of allowing the trader to sort the market data into some sort of aggregate, which he then works with. The impetus for the price movement is the liquidity represented by pending orders. Such orders are, for example, stop losses.

Have you ever had the market pick you out on a stop loss? Then at that very moment, you became liquidity for someone else. If you want to increase your chances of success in trading, you should learn to look for places in the market wher

A trader's goal should be: to trade liquidity, not to become it.

Ebook: How to trade Forex

In this ebook you will find explanation of basic terms and concepts in Forex trading, demonstrations of basic price formations on a chart and how to trade them, recommendations for appropriate trading support tools and much more!

Where to look for liquidity levels?

On various price formations (for example, double top), trend lines, horizontal supports and resistances, Price Value Gaps, previous swing high and low, etc., here we can find levels where liquidity can be looked for.

The principle is that traders usually look for these formations because they are widely known, and place their pending orders - no matter if it is a stop loss or another order (e.g. take profit, buy stop, etc.) - at the levels to which these formations "attract" them. Since they all know the same principles, the order volume accumulates at similar levels. However, for the market (or the big players) all these orders represent liquidity and therefore they will try to push the price of the instrument towards them.

In a chart, the liquidity picking will manifest itself by the fact that at a given level (which is easy for traders to read and therefore enter the trade), a certain "overshoot" of that level will first occur, i.e. the price will make a breakthrough. This gives the impression that the price starts to move in the direction of the breakout. However, the price then pulls back and continues in the opposite direction. Often such a situation is seen on the chart as a false break. These false breaks indicate that liquidity has been taken out and so the price can now go in the opposite direction.


Let's explain this with a simple example:


Simplified representation of liquidity collection

Simplified representation of liquidity collection


At point A, a peak is formed, so the trader draws a horizontal line from this level, which represents the resistance. At point B, on the other hand, there is a swing low, which represents support.

At point 1, the resistance has been broken. Here, stop losses are selected by those traders who speculate short and/or buy stop orders by those traders who speculate on a break of resistance A and expect an upward move for the break. Those who speculate long after the break will place their stop lots either below the B level or just below the A level.

These orders are then new liquidity for the market to pick up. Therefore, the market will reverse and instead of going up, it will now head down. The return of the price back below the A level then creates a false break at point 2 and after this false break the price heads down.

At point 3, the situation is analogous, only in reverse. First, a break of support occurs and this is due to the fact that orders have been accumulated here again. This time, these are stop loses of those traders who speculated long or sell stop orders of those traders who expected a break and assumed that the price would head further down. After these orders are selected, the price reverses, a false break is created again and the price continues in the opposite direction.

Tip: If you identify a false break in the chart, it is usually a strong signal to enter a trade in the opposite direction.

This is - very simplistically - the whole principle of liquidity selection. In practice, of course, the examples will not be so clear-cut, you need to learn to look for, levels where liquidity may be and then wait patiently for it to be selected. You enter the trade after the liquidity is selected and the price reversal is confirmed in some way (e.g. by an engulf candle, or Price Value Gap, etc.).

Where the most frequent liquidity withdrawals occur in the real market

High and low of the previous day, week, or month

We will show an example of liquidity selection on the low of the previous day. In the picture, we have the USDJPY pair on the H1 chart. At point A is the low of 11/14/2023, so it offers to plot horizontal support. Traders then often speculate that when the price approaches this low, it will then bounce upwards. They put a stop loss below this support. The following day, this low was selected when the US industrial inflation data was reported. This came out much better than expected and so it would be logical that the dollar should weaken. But the opposite happened.

The big players first pushed the dollar down after the report was announced to pick up pending orders that had accumulated below this support. After collecting these orders, the market reversed and quickly headed up to collect additional liquidity, which was now represented by orders from those traders who were convinced that USDJPY had to fall.

Thus, from a fundamental perspective, this intraday rise in the USDJPY pair was extremely illogical. However, from a price action perspective according to SMC, the big players went for filling the Price Value Gap that was created on 11/14/2023.
 

USDJPY on H1 chart

USDJPY on H1 chart

Tip: The high and low of the previous day, week, and month tend to be levels that the market likes to test. After taking out liquidity at these levels, wait for the market to reverse and create a false break of that level. Only then consider the trade. Confirmation to enter the trade can be on a lower time frame, you can use for example a Price Value Gap, or an engulfing candle, pin bar, etc.

1.2 Horizontal support and resistance

Liquidity withdrawals occur not only on the previous day's high and low, but also on various swing highs and lows, and they happen on all time frames.
 

EURJPY on D1 chart

EURJPY on D1 chart


The picture shows EURJPY on the daily chart. A top was formed at point 1, which was tested and slightly overcome at point 2, but the price then closed below this resistance. So a false break was created. The liquidity above the resistance has been taken out.

At point 3, liquidity was then picked up more strongly. Traders who were waiting for this situation were more confident because they saw that the top had already been tested, so they speculated that this resistance would work again. It did indeed work, but only after most traders had been kicked out of the market. These were those who had buy stop orders above that resistance because they speculated long after the resistance broke, or stop loss orders because they speculated short at that resistance.
 

1.3 Trend lines

Trend lines (TL) are another popular place to withdraw liquidity. The logic is that traders place stop loss orders just above a downtrend line, or just below an uptrend line. In practice, it then looks like this:
 

EURJPY on D1 chart

EURJPY on D1 chart


Points 1 and 2 are enough to draw a trend line. There was a slight break of this TL at point 3, but it was nothing major. Then at point 4, the break of the TL was more fundamental as the price closed below the TL. Thus, there was a stop loss collection that was placed below the TL.

What is going on in the trader's head at this point? Mostly, he will think that this strong move and break TL means that the uptrend is over and will therefore start speculating short. And because he wants to catch this move right at the start to get the best price, he quickly enters the trade short without waiting for a retest or some other form of confirmation. He then places a stop loss order above the price. However, these SLs represent liquidity and therefore the price has gone back above the TL.

There are many variations on the theme of picking liquidity. However, they always have one common denominator, which is inducement.

Boost your trading knowledge with Purple Academy!

Successful trader never stops learning. That is why we have created the Purple Academy where you can find interesting articles, knowledge-expanding ebooks and detailed trading turorials. So if you are interested, just dive in and start learning! (It’s free).

Smart Money - liquidity inducement

In the context of liquidity collection, the term inducement is used, which means "lure" or "trap".

From the examples above, you may have guessed what this is all about. When the market creates a readable situation, such as resistance, the trader thinks the price will turn there and enters the trade short, putting the stop loss above the resistance.

Often, however, he will do this too soon under the fear that he might miss the opportunity (technically known as FOMO (Fear of Missing Out). Price manipulation at these levels can also contribute to FOMO - for example, the price starts to make small pullbacks, so the trader gets the belief that the move will happen...etc. This trap will then attract other traders. Once enough orders accumulate above resistance, those will be picked first and then the real move will begin.

Inducement is therefore a situation that will give the impression that the price will move in a certain direction. Once enough orders (which are liquidity) have been lured in, they will first be picked. Only after this manipulation will the actual movement occur.

The following diagrams show us examples of different traps:

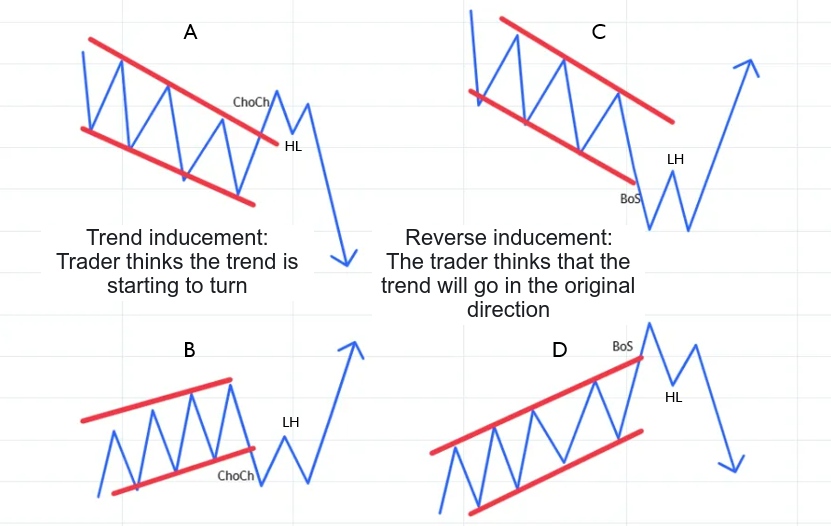
Examples of "inducements"


Inducements can arise in different trends and at different price points

The basic types are shown in Figure above:

  • Situations A and B are examples of situations where the trader thinks the trend is starting to turn, but after manipulation, the market continues in its original direction.
  • Situation A shows a clear downtrend. As soon as the last lower high is broken so that the first higher high is formed, the trader starts to think that a trend reversal (Change of Character) is occurring and starts to speculate long. However, the stop losses that he places below the first higher low (marked as "HL") serve as liquidity that the market will start to collect, and therefore the price will start to fall in the direction of the main trend.
  • Situation B shows an uptrend, when the first lower low is formed the trader starts to think that a change in trend is occurring, so he enters short, placing the stop loss above the lower high (marked as "LH"). This is then selected and the trend continues upwards in the original direction.
  • In situations C and D, a situation will arise where the trader is convinced that the trend is continuing in the original direction, only for the market to turn in the opposite direction.
  • In situation C, a BOS (break of structure) occurs in the downtrend and a new lower low is formed. This convinces the trader that the downtrend is gaining momentum. When a new lower high is formed. traders place stop losses above this lower high (LH). After liquidity is collected the price continues upwards.
  • In the case of situation D, this is analogous to an uptrend. Once the BOS occurs and a higher high is formed, the trader is confident that the uptrend will continue. He puts the stop loss below the new higher low (HL). These orders are then selected and the market reverses.
  • The above examples suggest that levels or patterns that indicate where liquidity withdrawals will occur tend to be more complex than mere false breaks on horizontal S-R zones. But if you start to look at the market through this lens, you will gradually gain experience that will open up a new dimension of trading.
 

How to trade liquidity

  1. On a higher frame - weekly, daily or H4, mark the main price levels and identify what trend is taking place (uptrend, downtrend, sideways).

  2. Since you now know that liquidity trading works by having the price sort of overshoot a given level, unlike the traditional plotting of supports and resistances, which tend to be shown as certain zones of a certain range, in the case of this concept, you just need to plot a simple line that comes from the highest point (in the case of resistance) or the lowest point (in the case of support).

  3. Then wait for the price to jump over that level. This is a signal that the market is picking up liquidity beyond that level.

  4. The next step is that the price must go back down (below the resistance line or above the support line). This will indicate that liquidity has been selected. This pullback must be valid, i.e. the candle should close in that area. This close in that zone should be clearly visible (see charts 5 and 6).

  5. To enter, wait for confirmation on a lower timeframe (e.g. Price Value Gap, engulf, pin bar, etc.).

  6. Since the liquidity withdrawal has already occurred, a tighter stop loss can be given which will then allow for a more favorable RRR. This is the main advantage of the whole concept.


Example:

In the picture we have the AUDCAD pair on the weekly chart. At point A a high has been formed, at point C a low. At these points, we then draw a line that will mark the liquidity selection limit. We then wait for the price to "cross" these boundaries. The "overshoot" occurred at points B and D.
 

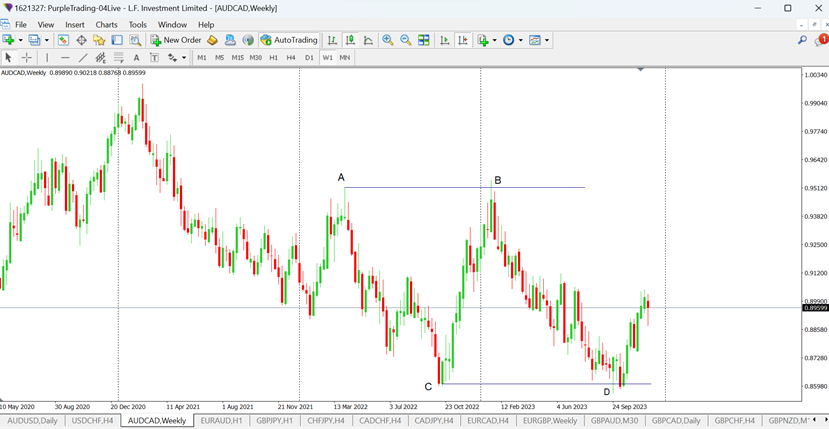
AUDCAD on the weekly chart


We then move to a lower timeframe, in this case D1, where we wait for a form of entry confirmation. In the case of the speculation at point B, it looked like this:

Price picked up liquidity through candle #1, and during the same day it came back below this resistance, where this candle also closed. This close below the resistance level is distinct, clearly visible, and easily identifiable, so it is valid (it would be invalid if the price closed above resistance, at resistance, or just slightly below resistance, which would not be distinctly clear).

Candle 1 also resembles a pin bar, which is a reversal formation. Entering at the next candle (indicated by the arrow) and with a stop loss above the high of the formation and speculating to the nearest support, a trade would be created with an RRR of 1:5.
 

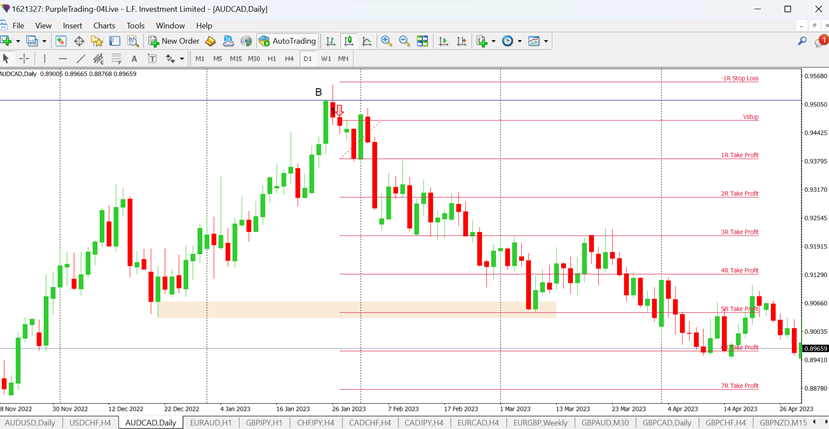
AUDCAD on D1 chart, speculation short


The next chart shows an analogous situation, this time in reverse.
 

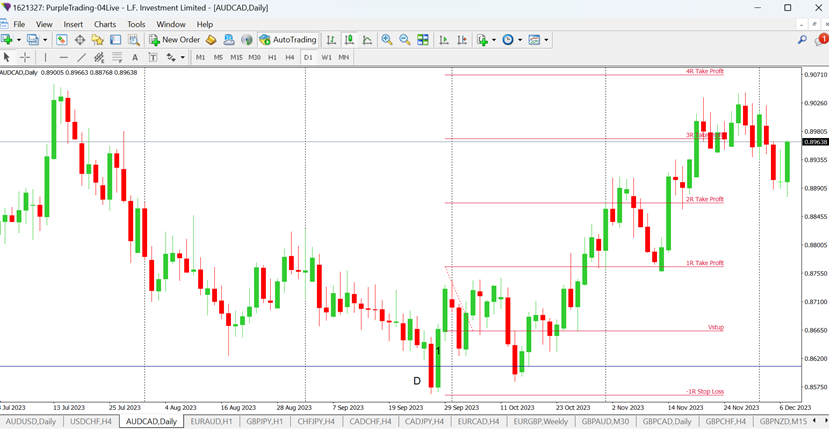
AUDCAD on D1 chart, speculation long


At point D, the price broke through support. After liquidity withdrawn, a bullish engulf was formed (candle 1) and the price closed above the support. Again, we can see that the close above support is significant, it is clearly visible and easily identifiable. This is a strong signal. Entering on the next candle and with a stop loss below the lowest price of the formation, an RRR of 1:3.5 would be formed to the nearest major top

Recommended articles

66.30 % of retail investors lose their capital when trading CFDs with this provider.

CFDs are complex instruments and come with a high risk of losing money rapidly due to leverage. 66.30 % of retail investors lose their capital when trading CFDs with this provider. You should consider whether you understand how CFDs work and whether you can afford to take the high risk of losing your money.