The Swing Overview - Week 39
The stock indices were on the swing last week. First, the markets weakened heavily on fears of the collapse of Evergrande, a large Chinese property developer. But apart from the problems of the Chinese developer, there is a positive mood everywhere else in the developed economies. In the second half of the week, the indices rose mainly under the influence of the expected news from the US Fed.
Evergrande missed the deadline for interest payments
Evergrande shares fell 11% in the Asian session on Friday, extending losses after a Reuters report that some bondholders abroad had not received interest payments by Thursday's deadline. Investors are nervous about Evergrande's $305 billion in debt. If the bankrupted, there are fears that the collapse could pose a risk to China's financial system. These fears then spill over into global equities.
Fed leaves interest rates unchanged
The Fed said on Wednesday that it could start tapering its monthly bond purchases as early as November. As for interest rates, the Fed announced that they might rise faster than expected.
In a press conference after the announcement, Fed Chairman Jerome Powell said the case for raising rates from zero is now much stronger than for cutting. The markets initially reacted to the news by falling. But then the indices started to rise and the US dollar lost ground.
The market reaction thus pointed to the fact that there were no major surprises at this meeting and that things were developing as expected.
The SP 500 broke the rising lower trend line
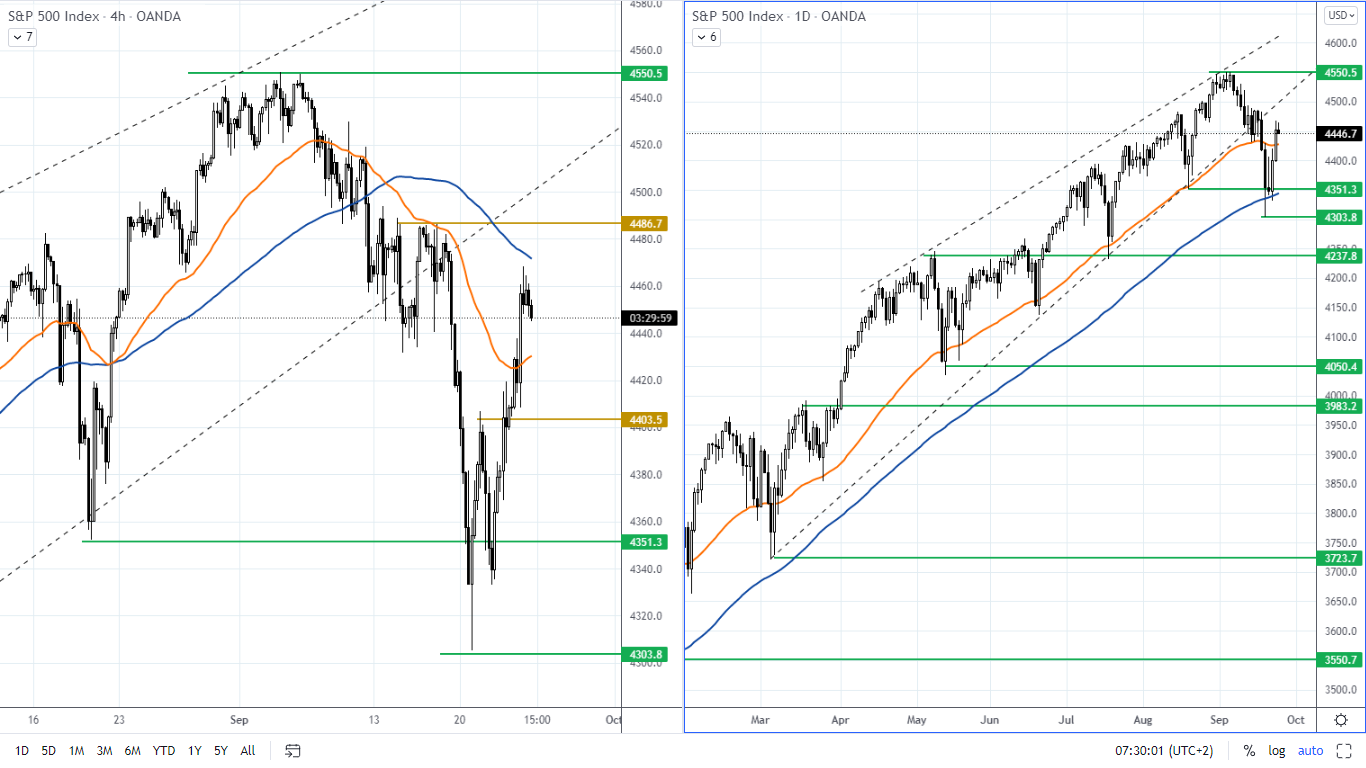
There was a visible breakout of the lower trend line of the rising wedge formation on the SP 500 index, which often appears in rising trends and can signal a slowdown or the end of an uptrend (negation of this signal will occur when price makes a new all-time high which would confirm a rising trend).
Last week on the decline, the price reached the support level at around 4350, which was also broken and the price formed a new support at around 4300. Here the price was rejected and reached the consolidation zone from which the previous decline was initiated earlier.
 Figure 1: The SP 500 index on the daily and H4 chart
On the H4 chart, the EMA 50 moving average is below the SMA 100, which together with the broken trend line indicates a bearish trend.
The DAX is moving along with the US indices
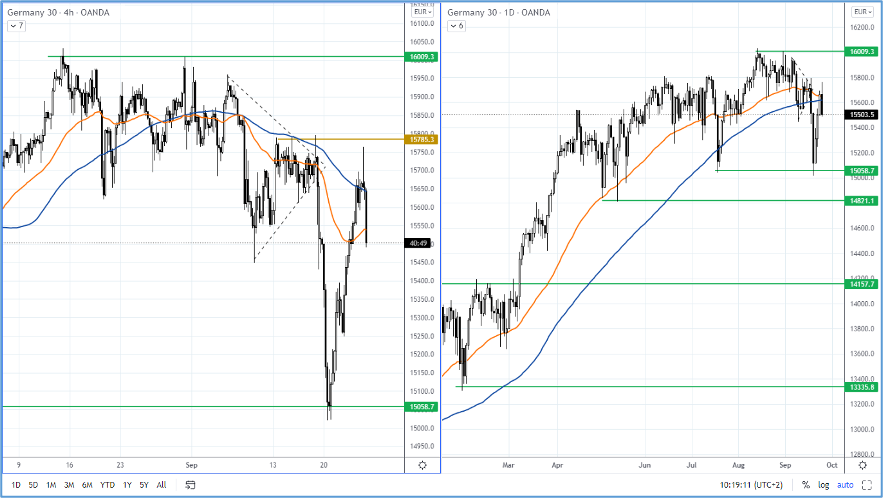
On the H4 chart, the DAX index had formed a triangle formation last week, which was broken to the downside as we expected. The price reached the support level according to the daily chart, which is at around 15,050. Here the price bounced back up to the SMA 100 moving average on the H4 chart.

Figure 2: DAX on daily and the 4H chart
The moving average EMA 50 is below the SMA 100 on the H4 chart. This indicates current bearish sentiment.
The euro continues to weaken against the dollar
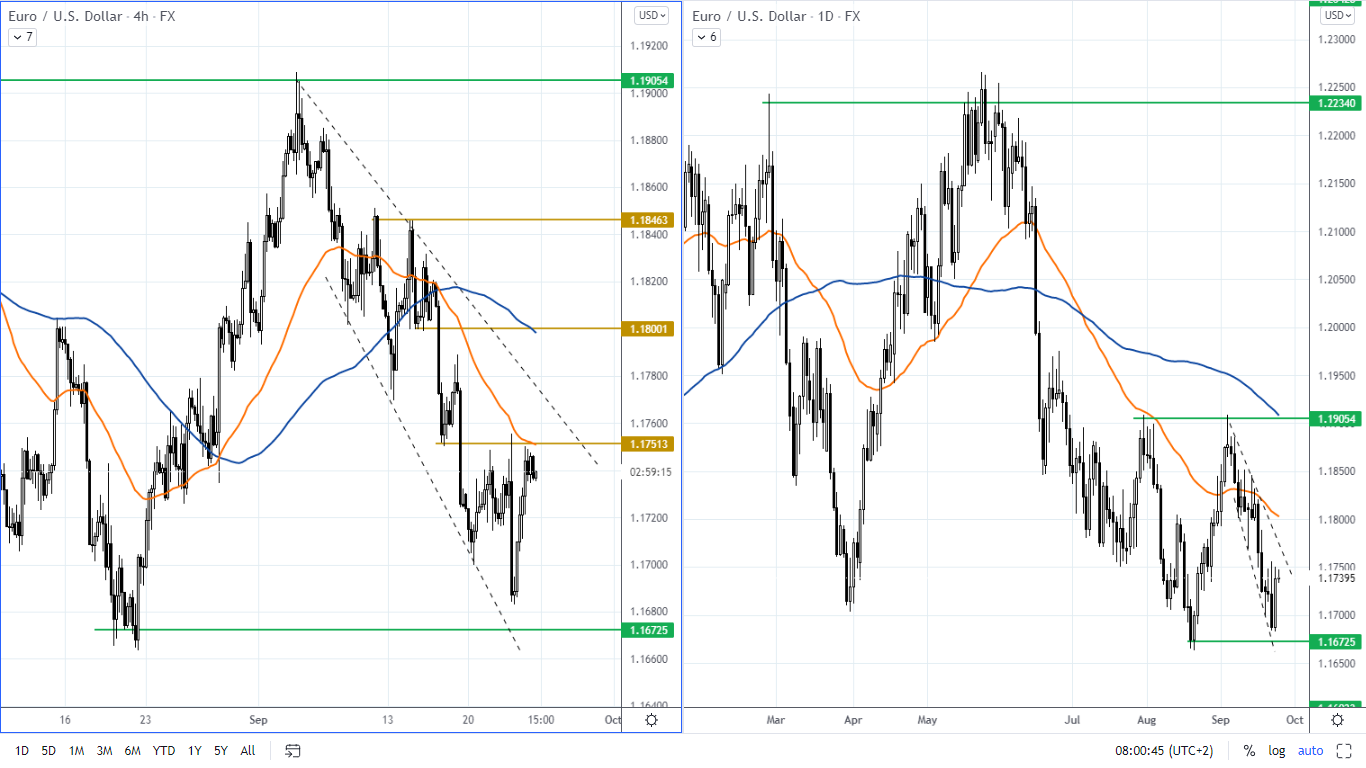
The euro is currently moving in a downtrend against the US dollar, which we can see on the 4H timeframe and also on the daily chart.
 Figure 3: EURUSD on H4 and daily chart
On the 4H chart, we can also see that the EMA 50 moving average has fallen below the SMA 100, which currently indicates bearish sentiment. The price has reached the resistance level on the H4 chart, which is determined by the confluence of the horizontal resistance line with the moving average EMA 50.
Any negative news regarding Evergrande could cause strengthening of the US Dollar and this could send the EURUSD to lower levels. Support is priced around 1.1670.
Rising US bond yields are dangerous for gold
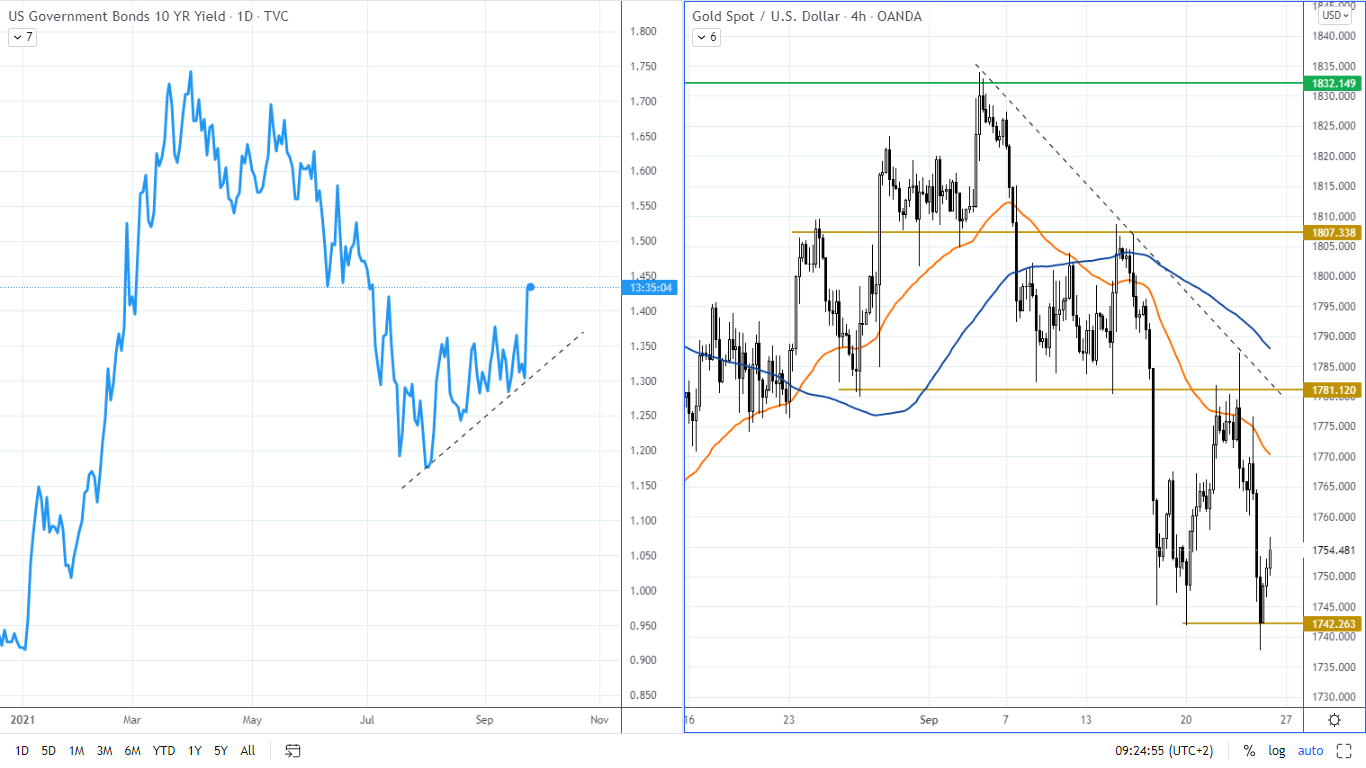
The yield on the US 10-year bonds strengthened to 1.444%, the highest level since July 2, and has gained 15 basis points in the last two days. The rise in US Treasury yields was then the reason for the fall in the price of gold, which offers no yield.
 Figure 4: The gold on the H4 chart and 10-year US government bond yields on the daily chart
Thus, the gold continues to move in a downtrend, which is confirmed by both the declining upper trend line on the H4 chart and the fact that the EMA 50 moving average is below the SMA 100.
The gold price fell to 1738 on Thursday, where it stopped at support. In case of a breakout, then we can expect a decline to the price of 1680. The resistance is in the zone around 1780.