The Swing Overview - Week 16
Jerome Powell confirmed that the Fed will be aggressive in fighting the inflation and confirmed tighter interest rate hikes starting in May. Equity indices fell strongly after this news. Inflation in the euro area reached a record high of 7.4% in March. Despite this news, the euro continued to weaken. The sell-off also continued in the Japanese yen, which is the weakest against the US dollar in last 20 years.
The USD index strengthens along with US bond yields
Fed chief Jerome Powell said on Thursday that the Fed could raise interest rates by 0.50% in May. The Fed could continue its aggressive pace of rate hikes in the coming months of this year.
US 10-year bond yields have responded to this news by strengthening further and have already reached 2.94%. The US dollar has also benefited from this development and has already surpassed the value 100 and continues to move in an uptrend.
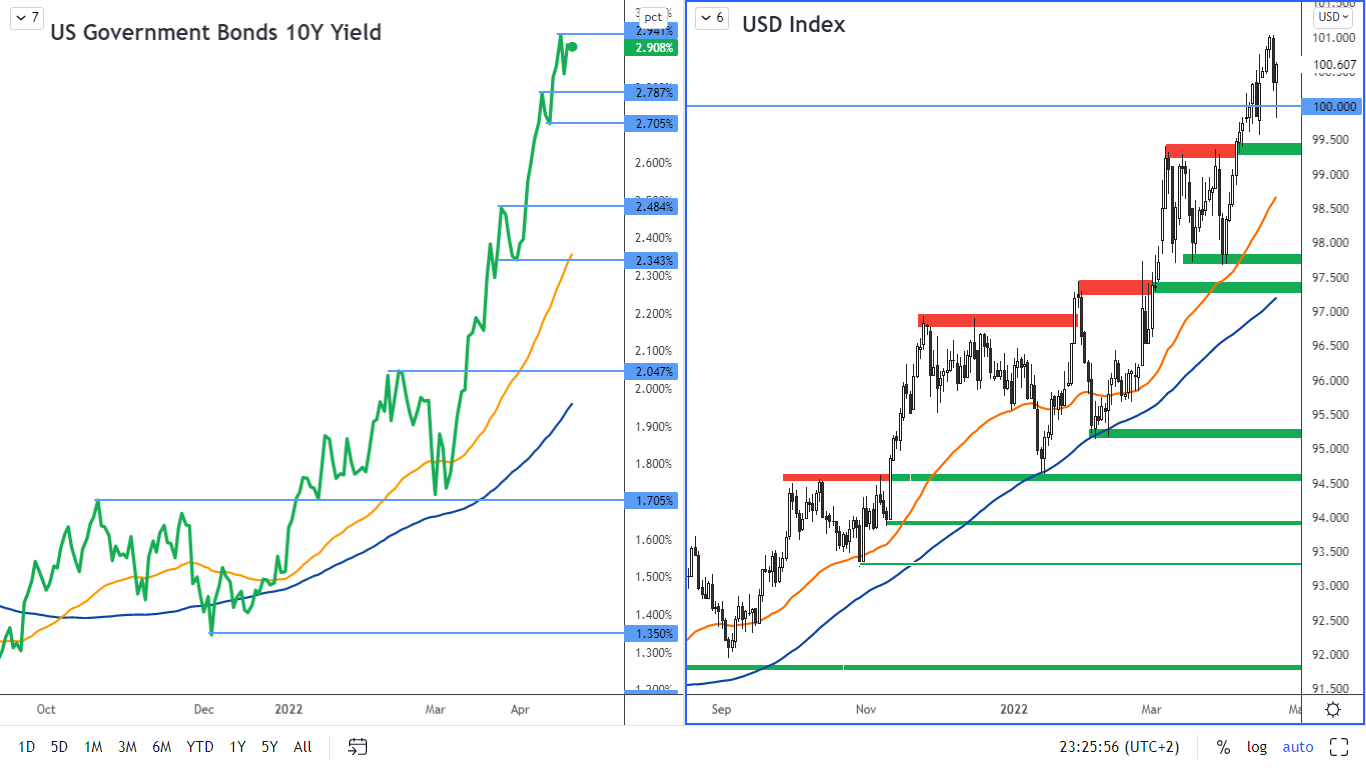
Figure 1: US 10-year bond yields and USD index on the daily chart
Earnings season is underway in equities
Rising interest rates continue to weigh on equity indices, which gave back gains from the first half of the last week and weakened significantly on Thursday following the Fed’s information on the aggressive pace of interest rate hikes.
In addition, the earnings season, which is in full swing, is weighing on index movements. For example, Netflix and Tesla reported results last week.
While Netflix unpleasantly surprised by reducing the number of subscribers by 200,000 in 1Q 2022 and the company's shares fell by 35% in the wake of the news, Tesla, on the other hand, exceeded analysts' expectations and the stock gained more than 10% after the results were announced. Tesla has thus shown that it has been able to cope with the supply chain problems and higher subcontracting prices that are plaguing the entire automotive sector much better than its competitors.
The decline in Netflix subscribers can be explained by people starting to save more in an environment of rising prices.
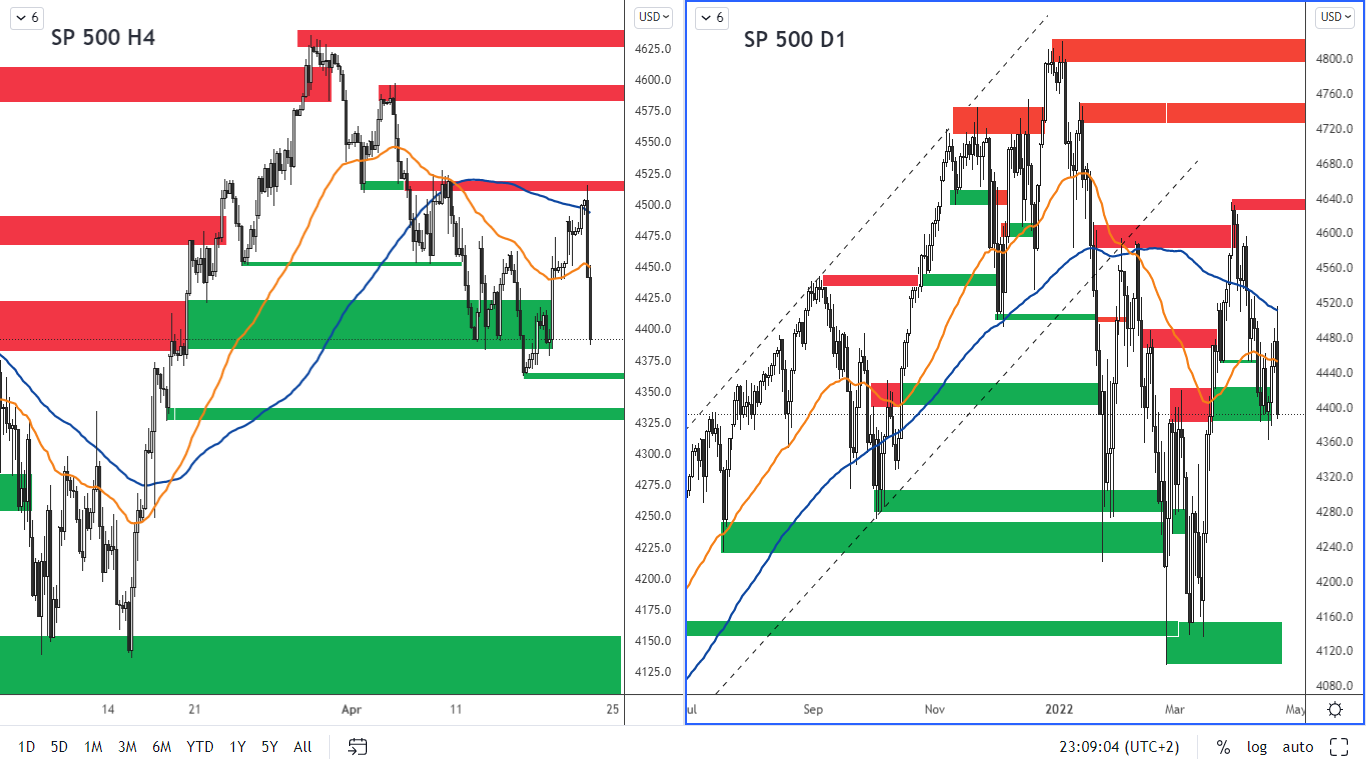 Figure 2: The SP 500 on H4 and D1 chart
The SP 500 index continues to undergo a downward correction, which is shown on the H4 chart. The price has reached the resistance level at 4,514-4,520. The price continues to move below the SMA 100 moving average (blue line) on the daily chart which indicates bearish sentiment.
The nearest resistance according to the H4 chart is at 4,514 - 4,520. The next resistance is around 4,583 - 4,600. The support is at 4,360 - 4,365.
The German DAX index
The DAX is also undergoing a correction and the last candlestick on the daily chart is a bearish pin bar which suggests that the index could fall further.
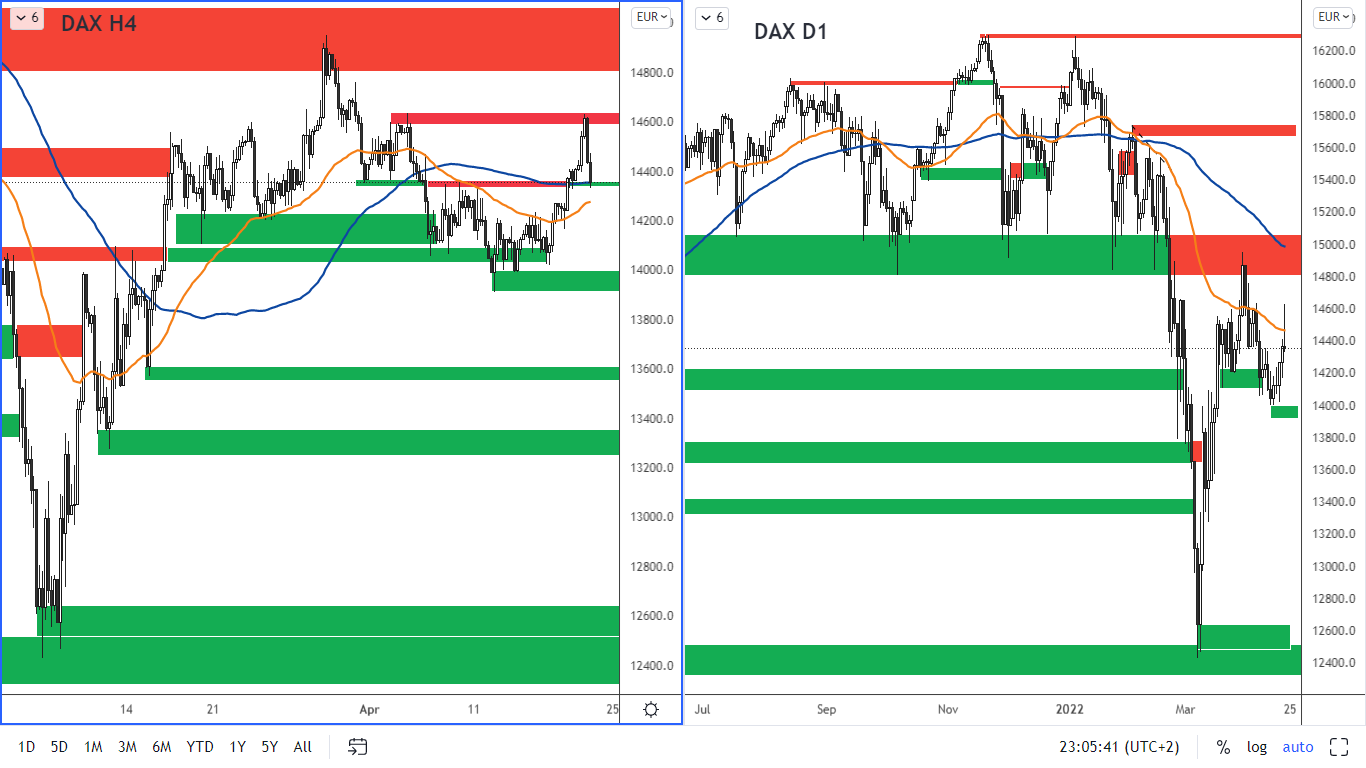 Figure 3: The German DAX index on H4 and daily chart
This index is also below the SMA 100 on the daily chart, confirming the bearish sentiment. The price has reached a support according to the H4 chart, which is at 14,340 - 14,370. However, this is very likely to be overcome quickly. The next support is 13 910 - 14 000. The nearest resistance is 14 592 - 14 632.
The DAX is affected by the French presidential election that is going to happen on Sunday April 24, 2022. According to the latest polls, Macron is leading over Le Pen and if the election turns out like this, it should not have a significant impact on the markets. However, if Marine Le Pen wins in a surprise victory, it can be very negative news for the French economy and would weigh on the DAX index as well.
The euro remains in a downtrend
The Fed's hawkish policy and the ECB's dovish rhetoric at its meeting on Thursday April 14, 2022, which showed that the ECB is not planning to raise rates in the short term, put further pressure on the European currency. The French presidential election and, of course, the ongoing war in Ukraine are also causing uncertainty.
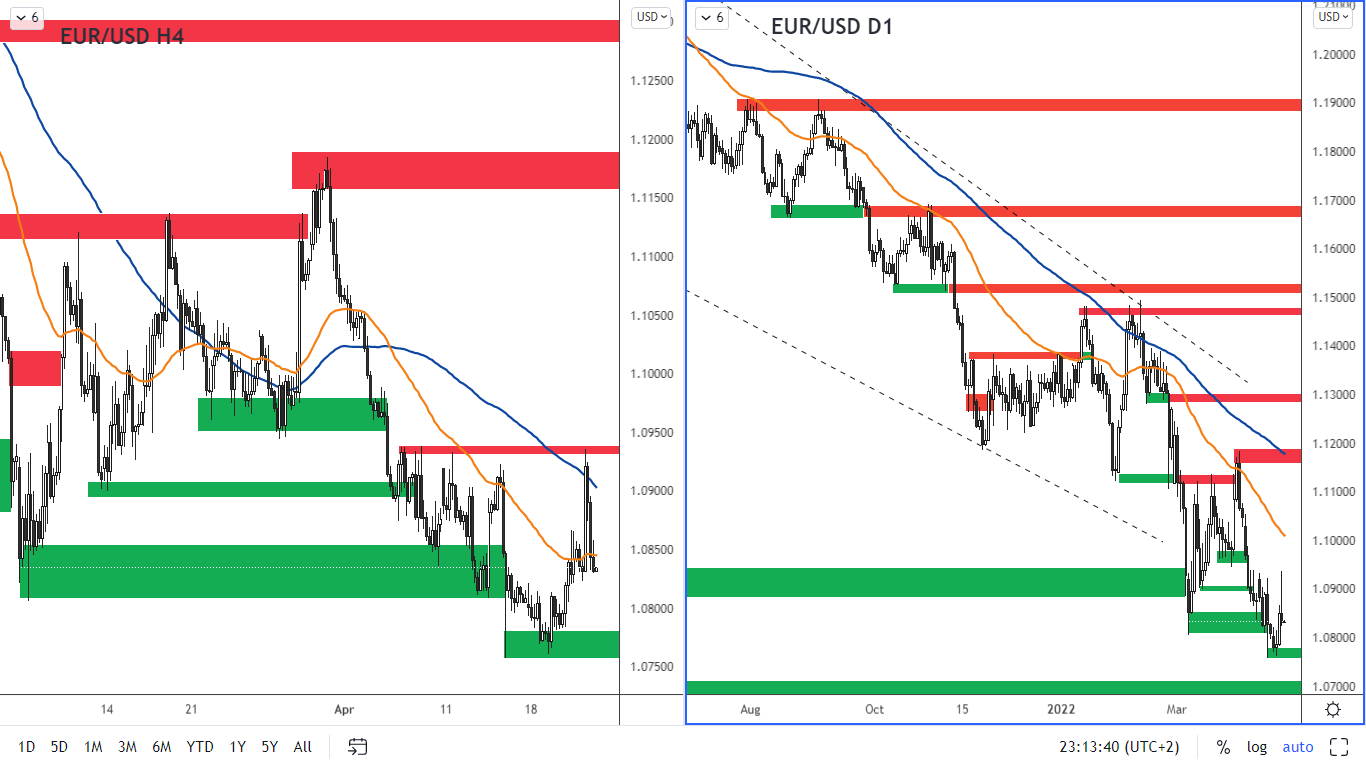 Figure 4: The EURUSD on the H4 and daily charts.
The inflation data was reported last week, which came in at 7.4% on year-on-year basis
Figure 4: The EURUSD on the H4 and daily charts.
The inflation data was reported last week, which came in at 7.4% on year-on-year basis. The previous month inflation was 5.9%. This rise in inflation caused the euro to strengthen briefly to the resistance level at 1.0930 - 1.0950. However, there was then a rapid decline from this level following the Fed's reports of a quick tightening in the economy. A support is at 1.0760 - 1.0780.
The sell-off in the Japanese yen is not over
The Japanese yen is also under pressure. The US dollar has already reached 20-year highs against the Japanese yen (USD/JPY) and it looks like the yen's weakening against the US dollar could continue. This is because
the Bank of Japan has the most accommodative monetary policy of any major central bank and continues to support the economy while the Fed will aggressively tighten the economy.
Thus, this fundamental suggests that a reversal in the USD/JPY pair should not happen anytime soon.
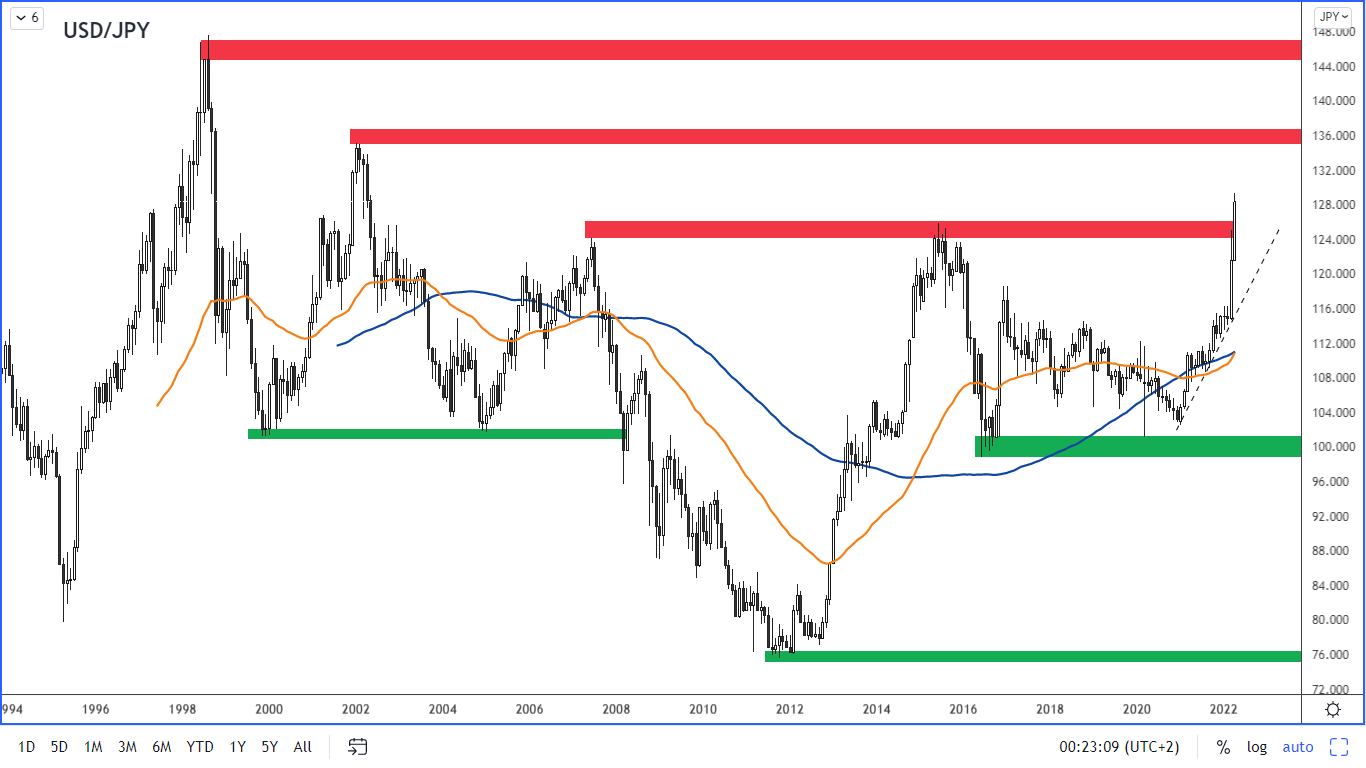 Figure 5: The USDJPY on the monthly chart
In terms of technical analysis, the USD/JPY price broke through the strong resistance band around the price of 126.00 seen on the monthly chart. The currency pair thus has room to grow further up to the resistance, which is in the area near 135 yens per dollar.