Positions of large speculators according to the COT report as at 2/4/2021
The total net positions of speculators in the USD index rose by 300 contracts last week. This change is the result of an increase in net long positions by 2,600 contracts and an increase in short positions by 2,300 contracts.
The significant decline in total net positions continued in the euro, which has been going on for several weeks and is gaining momentum. There was also a decline in total positions in the New Zealand dollar and the Japanese yen.
Total net positions rose in the British pound, the Australian dollar, the Canadian dollar and the Swiss franc.
Positive economic data from the US labor market continues to boost investors' appetite for risk, driving stock indices to new record highs despite rising US long-term bond yield, which has now stabilized at around 1.7%. This optimistic mood might support the euro and commodity currencies such as the New Zealand dollar.
The positions of speculators in individual currencies
The overall net positions of large speculators are shown in Table 1:
|
|
2/4/2021
|
26/3/2021
|
19/3/2021
|
12/3/2021
|
5/3/2021
|
26/2/2021
|
|
USD index
|
5,700
|
5,400
|
5,800
|
-8,900
|
-10,100
|
-13,900
|
|
EUR
|
73,700
|
93,300
|
90,000
|
102,000
|
126,000
|
138,400
|
|
GBP
|
25,000
|
21,800
|
28,600
|
33,900
|
36,100
|
31,000
|
|
AUD
|
12,300
|
5,900
|
7,600
|
8,100
|
6,000
|
- 1,600
|
|
NZD
|
4,000
|
4,700
|
6,000
|
17,100
|
16,400
|
14,600
|
|
CAD
|
6,500
|
5,100
|
10,300
|
11,000
|
15,300
|
9,100
|
|
CHF
|
4,300
|
2,900
|
4,700
|
14,400
|
12,300
|
11,500
|
|
JPY
|
-59,500
|
-53,500
|
-39,400
|
6,500
|
19,300
|
28,600
|
Table 1: Total net positions of large speculators
Notes:
Large speculators are traders who trade large volumes of futures contracts, which, if the required limits are met, must be reported to the Commodity Futures Trading Commission. Typically, this includes traders such as funds or large banks. These traders mostly focus on trading of long-term trends.
Total net positions are the difference between the number of bullish long contracts and the number of bearish short contracts. The data is published every Friday and is delayed because it shows the status on Tuesday of the week.
The sentiment of large speculators will allow you to see what position this group occupies in the market. It is important to monitor the overall trend of total net positions, but also separately the trend of bearish short positions and the trend of bullish long positions. Extreme values of total net positions are also important as they often serve as signals of a trend reversal.
It is also important to monitor the turning points, when the total net positions change from bullish sentiment to bearish and vice versa. These inflection points are indicated in the graphs in section 3.
The chart compares the current value of the total net positions of large speculators with the value 3 years ago. A score of 0% means that speculators are at their lowest levels in 3 years. A score of 100% means that speculators are at the highest values in the last 3 years. A value of 80% or more means that speculators are extremely bullish, and a value of 20% or less means that speculators are extremely bearish.
Detailed analysis of selected currencies
Explanations:
-
Purple line and histogram in the chart window: this is information on the overall net position of large speculators.
-
Green linein the indicator window: these are the bullish positions of large speculators.
-
Red line in the indicator window: indicates the bearish positions of large speculators.
If there is a green line above the red line in the indicator window, then it means that the overall net positions are positive, i.e. that bullish sentiment prevails. If, on the other hand, the green line is below the red line, then bearish sentiment prevails and the overall net positions of the big speculators are negative.
Charts are made with the use of www.tradingview.com.
Euro
|
Date
|
Weekly change in open interest
|
Weekly change in total net positions of speculators
|
Weekly change in total long positions of speculators
|
Weekly change in total short positions of speculators
|
Sentiment
|
| 2/4/2021 |
3,700 |
- 19,600 |
- 700 |
18,900 |
Weakening bullish |
| 26/3/2021 |
2,451 |
3,300 |
- 400 |
- 3,700 |
Weakening bullish |
| 19/3/2021 |
- 83,100 |
- 12,000 |
- 11,700 |
300 |
Weakening bullish |
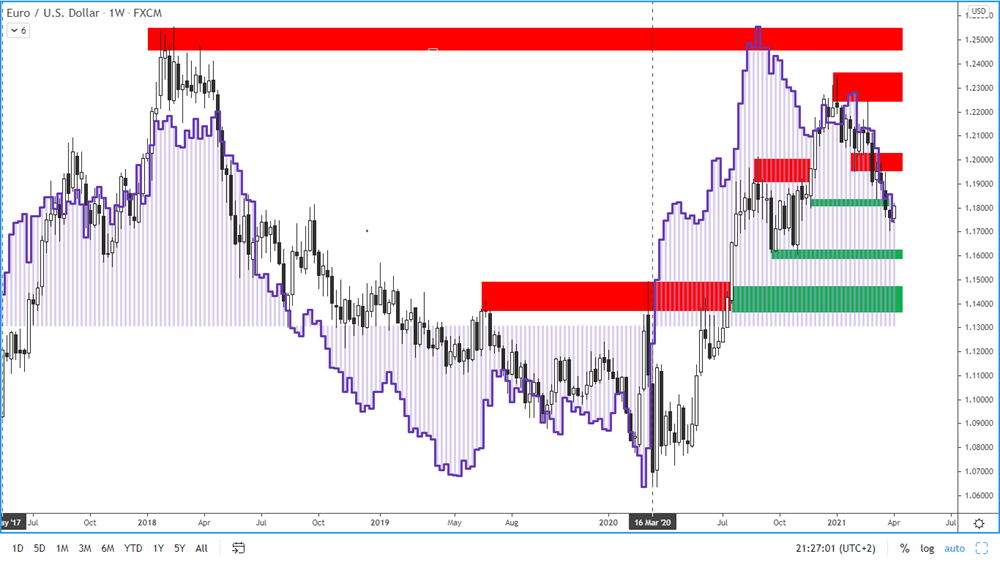
Figure1: The euro and COT positions of large speculators on a weekly chart
Total net positions fell by 19,600 contracts last week. This change is due to a decrease in net long positions by 700 contracts and an increase in net short positions by 18,900 contracts.
The price of the euro continued to fall last week, reaching 1.1700.
Long-term resistance: 1.1960 - 1.2020
Long-term support: 1.1600 - 1.1620
The British Pound
|
Date
|
Weekly change in open interest
|
Weekly change in total net positions of speculators
|
Weekly change in total long positions of speculators
|
Weekly change in total short positions of speculators
|
Sentiment
|
| 2/4/2021 |
- 6,300 |
3,200 |
- 4,600 |
- 7,800 |
Bullish |
| 26/3/2021 |
- 1,900 |
- 6,800 |
- 3,400 |
3,400 |
Weakening bullish |
| 19/3/2021 |
- 33,300 |
- 5,300 |
- 6,100 |
- 800 |
Weakening bullish |
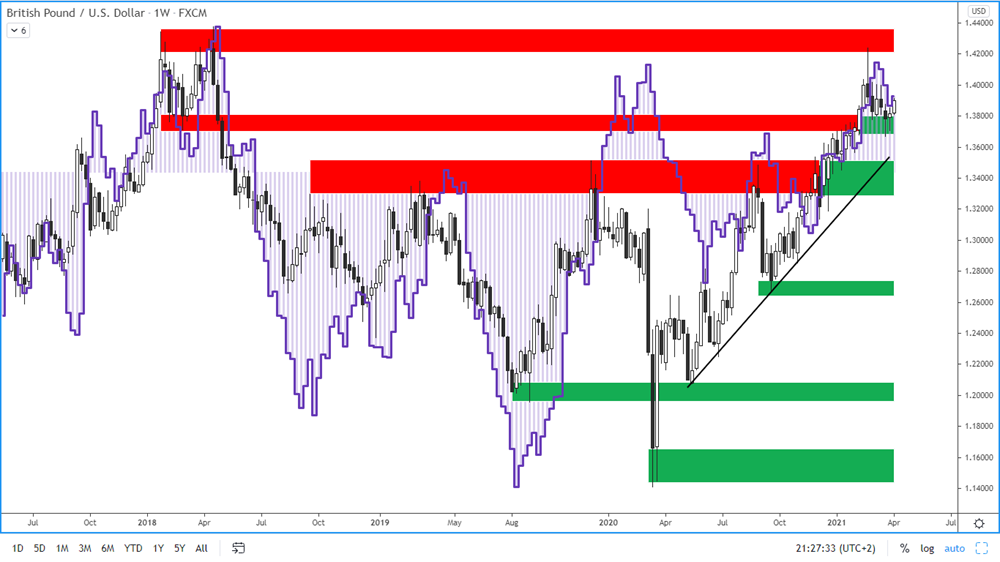
Figure 2: The GBP and COT positions of large speculators on a weekly chart
Last week, total net positions rose by 3,200 contracts. This change is the result of a decrease in net long positions by 4,600 contracts, while net short positions decreased by 7,800 contracts.
The pound strengthened slightly last week and it moved in the range between 1.37-1.3850.
Long-term resistance: 1.42-1.4350
Long-term support: 1.37-1.3800
The Australlian Dollar
|
Date
|
Weekly change in open interest
|
Weekly change in total net positions of speculators
|
Weekly change in total long positions of speculators
|
Weekly change in total short positions of speculators
|
Sentiment
|
| 2/4/2021 |
4,100 |
6,400 |
7,600 |
1,200 |
Bullish |
| 26/3/2021 |
3,900 |
- 1,700 |
1,200 |
2,900 |
Weakening bullish |
| 19/3/2021 |
- 20,900 |
-500 |
- 4,000 |
- 3,500 |
Weakening bullish |
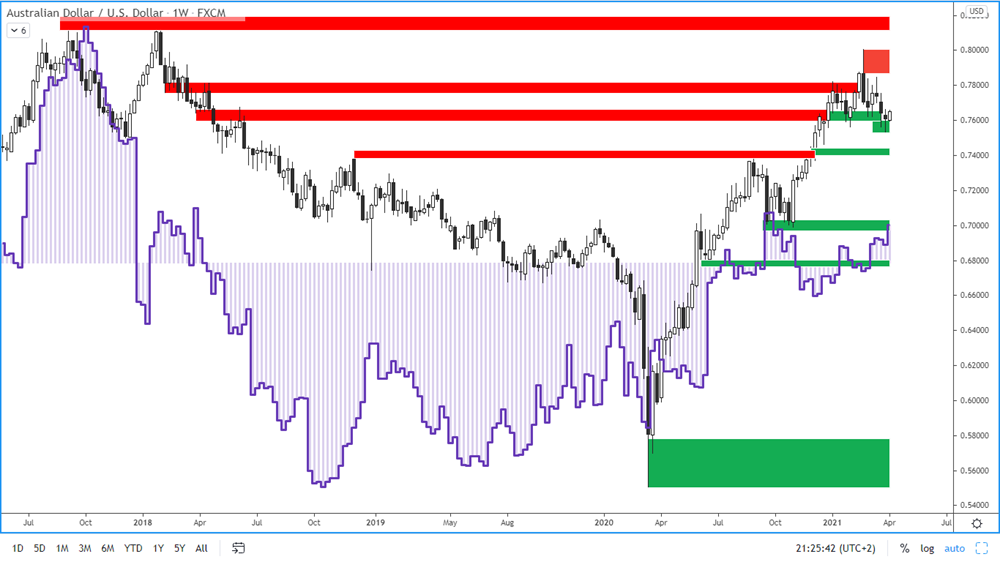
Figure 3: The AUD and COT positions of large speculators on a weekly chart
Last week, total net positions grew by 6,400 contracts. This change is due to the growth in long positions by 7,600 and the growth in short positions by 1,200 contracts.
The Australian dollar continued to weaken slightly last week, ending the week at 0.76 support.
Long-term resistance: 0.7870-0.8000
Long-term support: 0.7600-0.7650
The New Zealand Dollar
|
Date
|
Weekly change in open interest
|
Weekly change in total net positions of speculators
|
Weekly change in total long positions of speculators
|
Weekly change in total short positions of speculators
|
Sentiment
|
| 2/4/2021 |
- 1,400 |
- 700 |
- 1,400 |
- 700 |
Weakening bullish |
| 26/3/2021 |
3,700 |
- 1,300 |
400 |
1,700 |
Weakening bullish |
| 19/3/2021 |
- 16,800 |
- 11,100 |
- 12,600 |
- 1,500 |
Weakening bullish |
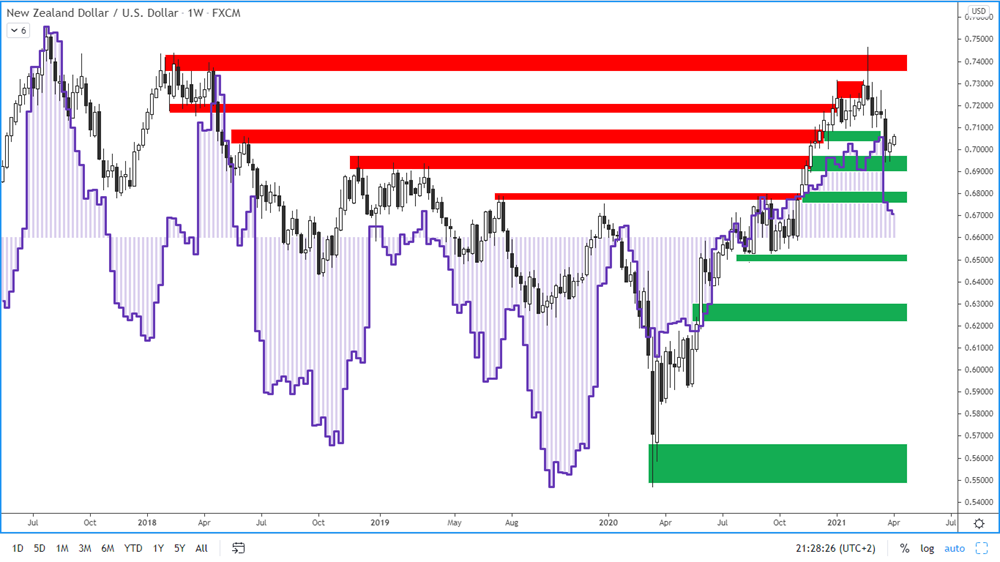
Figure 4: The NZD and the position of large speculators on a weekly chart
Last week, total net positions fell by 700 contracts. This change is the result of a decrease in net long contracts by 1,400 and a decrease in net short contracts by 700.
The NZDUSD price strengthened slightly last week. Kiwi might rise also this week due to risk on sentiment.
Resistance: 0.7370-0.7450
The nearest support: 0.6900-0.6960