Positions of large speculators according to the COT report as at 1/1/2021
Total net positions in the USD index increased by 300 contracts. This change is the result of an increase in net long positions by 1,100 and a decrease in net short positions by 800 contracts. The total net positions in the USD index have been negative for eight consecutive weeks.
The decline in total net positions continued in the euro, the British pound, the Swiss franc, the Australian dollar and the New Zealand dollar.
The increase in total net positions was in the Canadian dollar and also in the Japanese yen last week.
The positions of speculators in individual currencies
| |
4/1/2021
|
28/12/2020
|
18/12/2020
|
11/12/2020
|
4/12/2020
|
27/11/2020
|
|
USD index
|
-14 600
|
-14 900
|
-14 100
|
-6 500
|
-3 100
|
- 2 800
|
|
EUR
|
143 100
|
143 900
|
141 800
|
156 400
|
139 900
|
138 200
|
|
GBP
|
4 800
|
6 000
|
4 100
|
5 700
|
-7 900
|
-17 100
|
|
AUD
|
-6 500
|
- 4 400
|
-9 300
|
-10 100
|
-10 800
|
-5 300
|
|
NZD
|
12 500
|
13 700
|
14 200
|
10 600
|
9 100
|
8 300
|
|
CAD
|
15 400
|
10 100
|
-15 700
|
-20 800
|
-21 200
|
-16 800
|
|
CHF
|
11 800
|
12 200
|
9 300
|
10 400
|
14 700
|
15 000
|
|
JPY
|
47 300
|
46 100
|
44 000
|
48 200
|
47 500
|
40 200
|
Table 1: Total net positions of large speculators
Notes:
Large speculators are traders who trade large volumes of futures contracts, which, if the required limits are met, must be reported to the Commodity Futures Trading Commission. Typically, this includes traders such as funds or large banks. These traders mostly focus on trading of long-term trends.
Total net positions are the difference between the number of bullish long contracts and the number of bearish short contracts. The data is published every Friday and is delayed because it shows the status on Tuesday of the week.
The sentiment of large speculators will allow you to see what position this group occupies in the market. It is important to monitor the overall trend of total net positions, but also separately the trend of bearish short positions and the trend of bullish long positions. Extreme values of total net positions are also important as they often serve as signals of a trend reversal.
It is also important to monitor the turning points, when the total net positions change from bullish sentiment to bearish and vice versa. These inflection points are indicated in the graphs in section 3.
Strength of individual currencies for the period of last 3 years
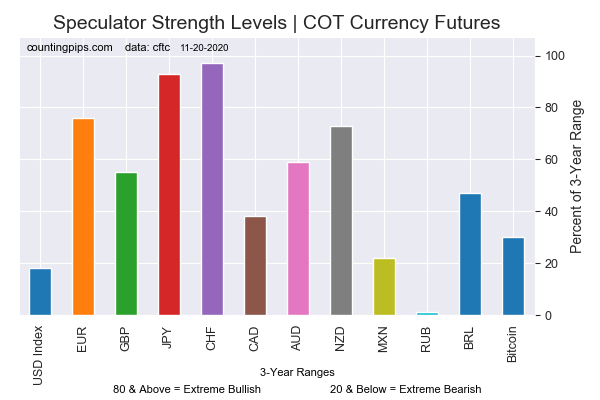 Figure 1: The strength of currencies according to speculators, source: www.countingpips.com
The chart compares the current value of the total net positions of large speculators with the value 3 years ago. A score of 0% means that speculators are at their lowest levels in 3 years. A score of 100% means that speculators are at the highest values in the last 3 years. A value of 80% or more means that speculators are extremely bullish, and a value of 20% or less means that speculators are extremely bearish.
Detailed analysis of selected currencies
Explanations:
-
Purple line and histogram in the chart window: this is information on the overall net position of large speculators.
-
Green linein the indicator window: these are the bullish positions of large speculators.
-
Red line in the indicator window: indicates the bearish positions of large speculators.
If there is a green line above the red line in the indicator window, then it means that the overall net positions are positive, i.e. that bullish sentiment prevails. If, on the other hand, the green line is below the red line, then bearish sentiment prevails and the overall net positions of the big speculators are negative.
Charts are made with the use of www.tradingview.com.
The Euro
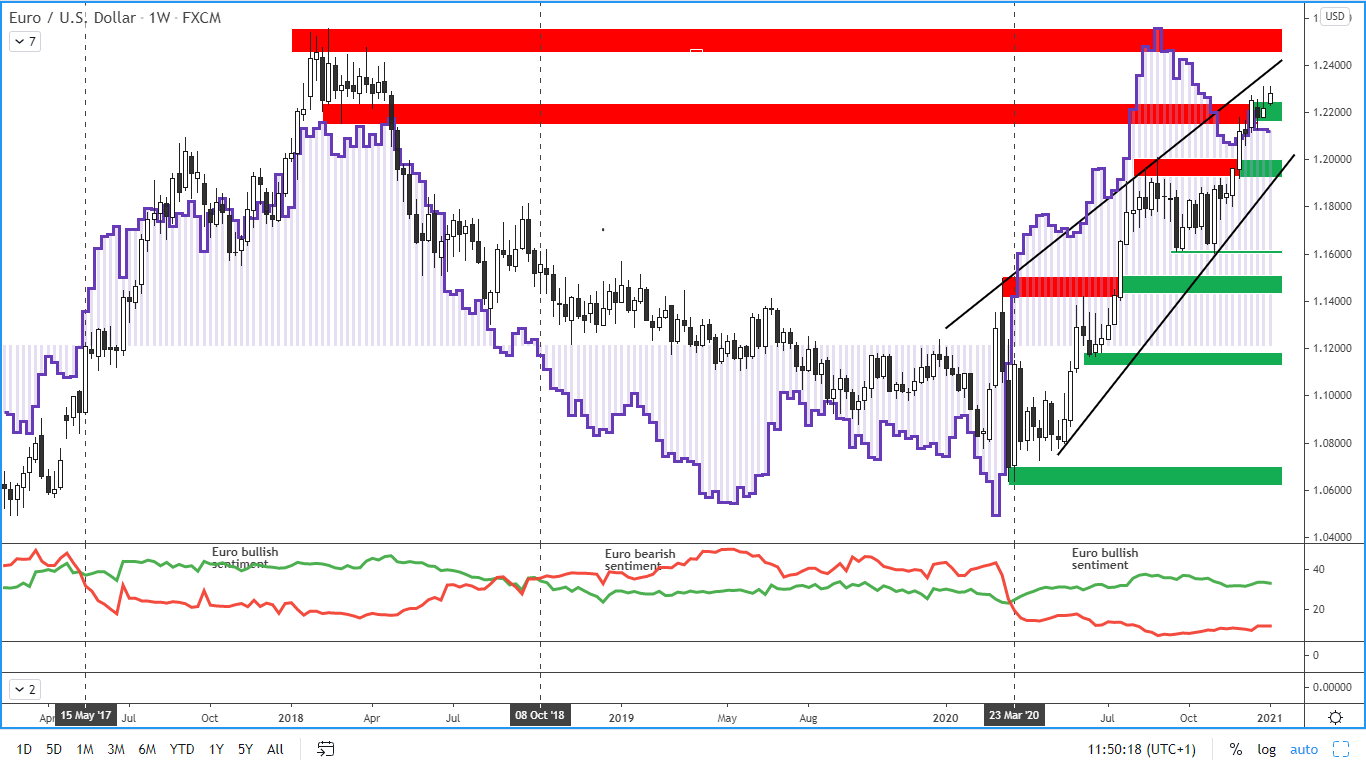
Figure 2: The euro and COT positions of large speculators on a weekly chart
The price of the euro last week exceeded the set level of resistance at 1.2250. Currently, the price is again above this level.
Total net positions fell by 800 contracts last week. This change is the result of an increase in net long positions of 400 contracts and an increase in net short positions by 1,200 contracts.
Long-term resistance: 1.2450 - 1.2550
Long-term support: 1.1950 - 1.2000
The British pound
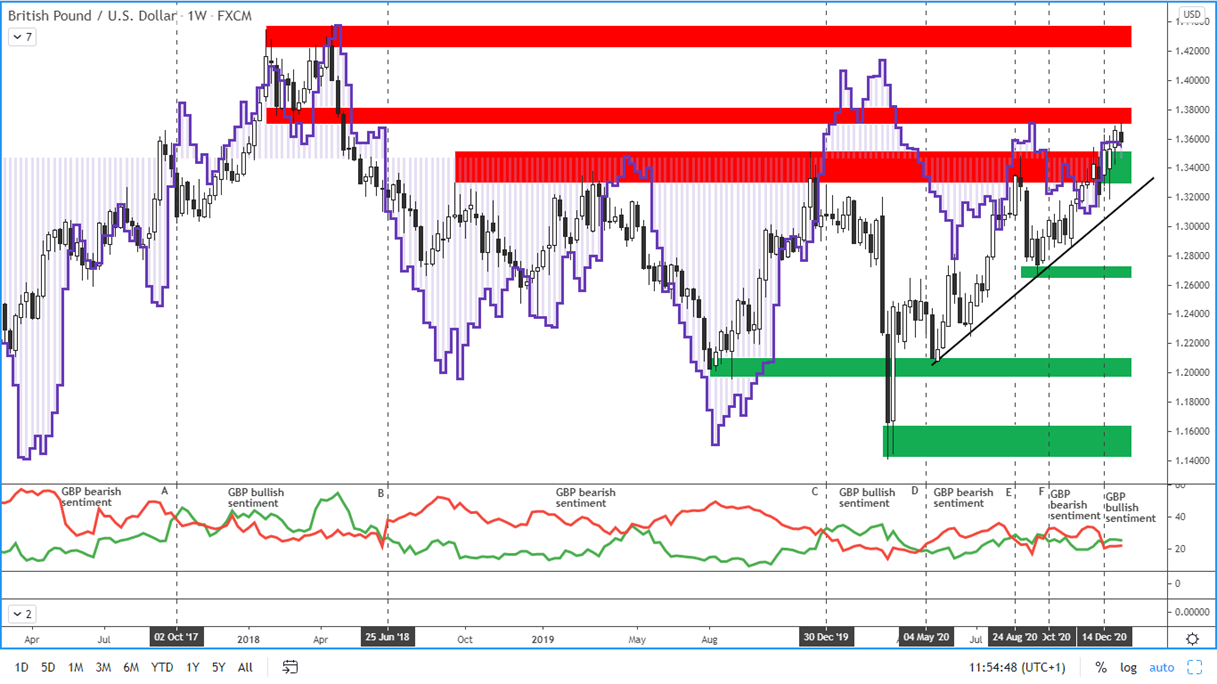
Figure 3: The GBP and COT positions of large speculators on a weekly chart
Last week, total net positions fell by 1,200 contracts. This change is the result of a decrease in net long positions by 1,800 contracts, while net short positions decreased by 600 contracts.
The pound broke through the previous strong resistance in the range of 1.33-1.35 which is now becoming a support.
Long-term resistance: 1.37-1.3820
Long-term support: 1.33-1.3500
The Australian dollar
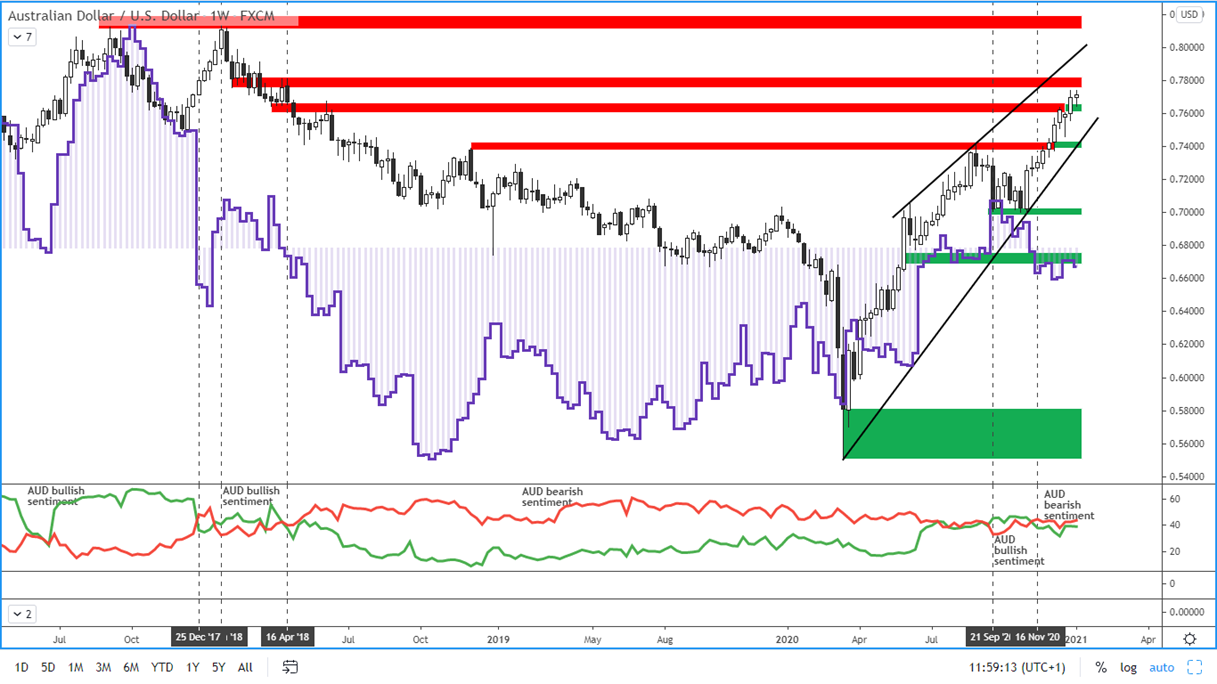
Figure 4: The AUD and COT positions of large speculators on a weekly chart
Total net positions are in bearish sentiment in the Australian dollar for the 9th week in a row. Last week, total net positions fell by 2,100 contracts. This change is the result of an increase in net long positions by 500 contracts, while net short positions decreased by 2,600 contracts.
The Australian dollar is on a weekly chart in a rising trend and last week surpassed the resistance of 0.7600-0.7650, which has now become a new support.
Long-term resistance: 0.7750-0.7820
Long-term support: 0.7600-0.7650
The New Zealand dollar
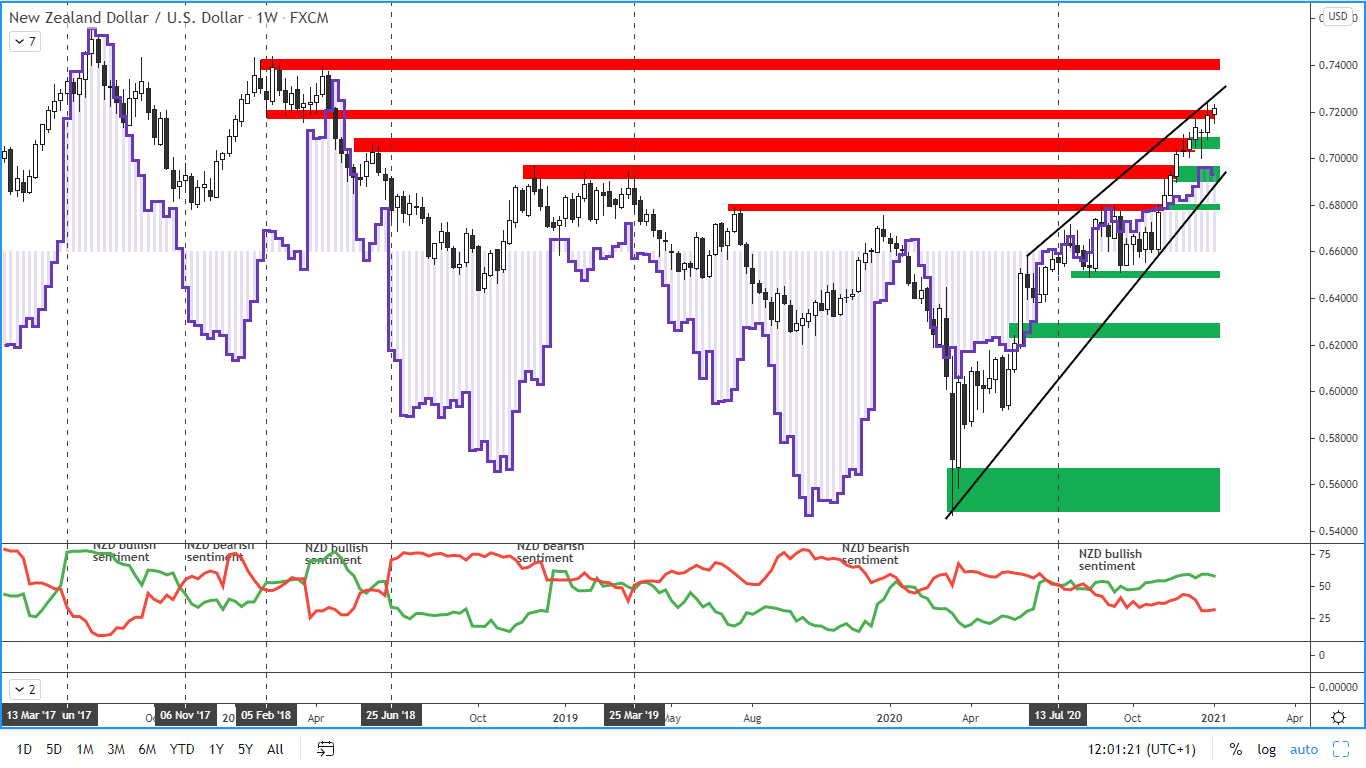
Figure 5: The NZD and the position of large speculators on a weekly chart
In the New Zealand dollar, overall net positions are still in bullish sentiment, which has been going on for 20 consecutive weeks. Last week, total net positions fell by 1,200 contracts. This change is the result of a decrease in net long contracts by 900 and an increase in net short contracts by 300.
The NZDUSD price reached a resistance level of 0.7200 last week.
Resistance: 0.7150-0.7200
The nearest support: 0.7020-0.7080