66.30 % of retail investors lose their capital when trading CFDs with this provider.

CFDs are complex instruments and come with a high risk of losing money rapidly due to leverage. 66.30 % of retail investors lose their capital when trading CFDs with this provider. You should consider whether you understand how CFDs work and whether you can afford to take the high risk of losing your money.

MACD oscillator and why you want it in your trading

Published: 22.09.2023

There are plenty of trading tools to help you enter the market. However, only a few of them are designed to give your decisions the hallmark of objectivity at the same time. Today, we'll take a look at one such tool.

In our last article, we showed you how to bring objectivity to your trading by avoiding the use of tools that rely on your subjective opinion, judgment or intuition. We also listed a few tools that are based on objectivity. Therefore, today we will introduce the MACD oscillator, which can bring objectivity to your trading decisions when entering the market.

What is MACD oscillator

Created by analyst Gerard Appel in 1979, the MACD (Moving Average Convergence/Divergence) indicator examines the convergence and divergence of moving averages. It is the value difference between the long-term value and the short-term exponential moving average.

The MACD oscillator uses many strategies. However, it is also used, for example, in stock market speculation or as part of automated trading systems (or trading robots, if you prefer).


The most common settings of the MACD indicator are as follows:

Common MACD indicator settings. The buy and sell signals are the intersection of two lines


We interpret the indicators as follows:

 
  • MACD line crosses the signal line from below - it is a signal to buy and announce an uptrend.

  • The MACD line crosses the signal line from above - it is a signal to sell and an announcement of a trend reversal.

  • The lines are too high above the zero line - an overbought condition.

  • The lines are too far below the zero line - an oversold condition.

When is a divergence on the chart and what does it mean for us?

When the value of an indicator moves in the opposite direction to the price, we say it is a divergence.

Divergences occur when there is a discrepancy between the Price Action and the oscillator values on the chart. This often happens near support and resistance levels or supply and demand zones. Such divergences can tell us when it is appropriate to enter the market, either in the early stages of a trend or even during a correction.
 

Types of divergence


There are 4 types of divergence. Its basic feature is that they indicate market "exhaustion" when the oscillator values do not confirm new highs or lows in the price chart.

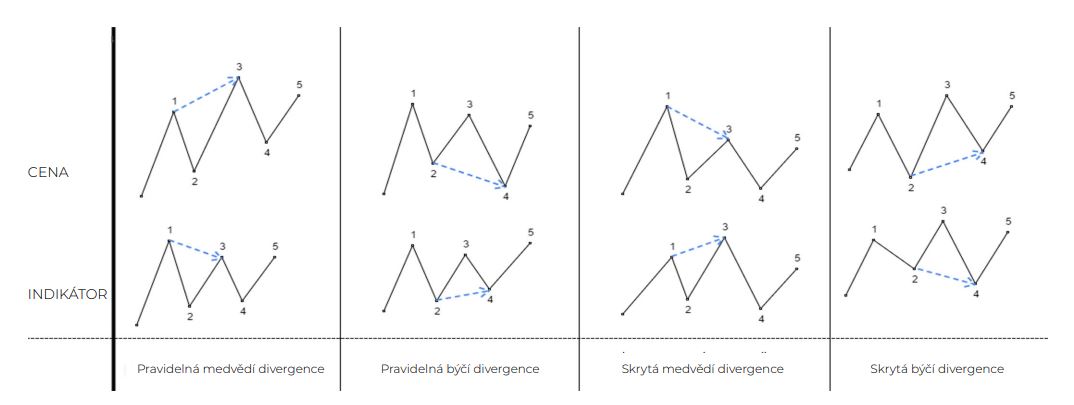
Comparing the price chart with the index chart, we can distinguish 4 types of divergence. Their usefulness in my strategy is independent of their type. They are all equally valuable


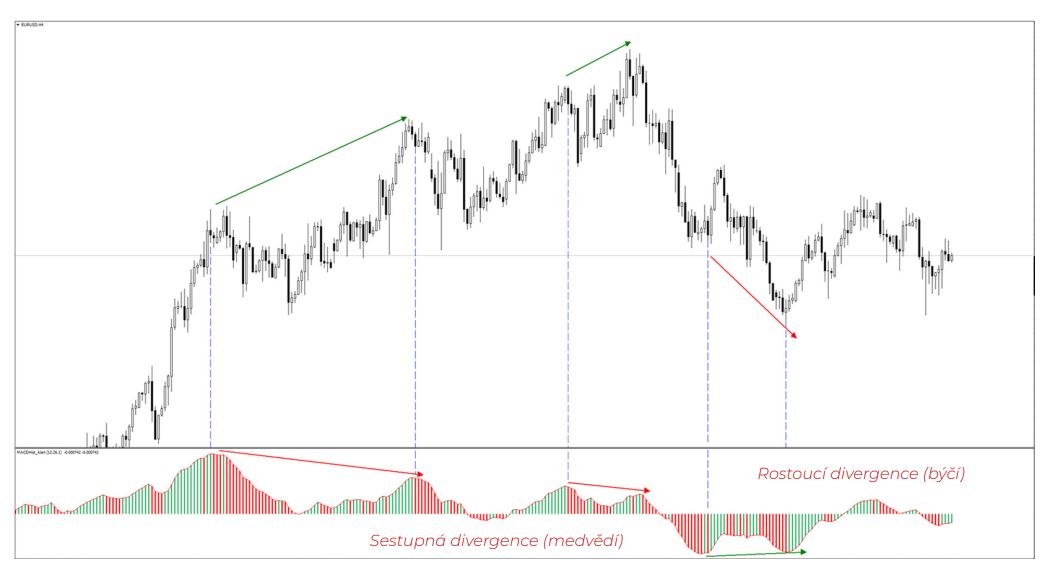
When using the two-color MACD oscillator, it is very easy to see when a divergence has appeared on the chart. Here the MACD changes color and the line connecting its two highs or lows has a different (opposite) slope than the line connecting the highs or lows on the price chart


By using the MACD oscillator in the way mentioned above, we have a great chance to correctly predict whether the price will rise or fall in the near future. When a downward (bearish) divergence appears, the probability that the price will start to fall increases. A bullish divergence indicates the opposite.

Of course, you should always look for further confirmation when it comes to predicting price behavior. For example, if divergences appear at important support or resistance levels and/or are supported by certain Price Action patters such as:
 

  • Inside bar
  • Outside bar
  • Pin bar
  • RGR
  • Wedge pattern

Recommended articles

66.30 % of retail investors lose their capital when trading CFDs with this provider.

CFDs are complex instruments and come with a high risk of losing money rapidly due to leverage. 66.30 % of retail investors lose their capital when trading CFDs with this provider. You should consider whether you understand how CFDs work and whether you can afford to take the high risk of losing your money.