66.30 % of retail investors lose their capital when trading CFDs with this provider.

CFDs are complex instruments and come with a high risk of losing money rapidly due to leverage. 66.30 % of retail investors lose their capital when trading CFDs with this provider. You should consider whether you understand how CFDs work and whether you can afford to take the high risk of losing your money.

Introduction to Price action III: Reversal Chart Patterns

Published: 08.03.2023

The third and final part of our price action series will teach you how to recognize reverse formations. These are price formations that signal a change in trend.


In the chapter on continuous chart patterns, we said that candlestick patterns consist of one or up to 5 candlesticks, while chart patterns, on the other hand, consist of multiple candlesticks and they take a longer time to create. Trend lines are often used to identify chart patterns to help identify areas of support and resistance. Attention is paid to breaking these lines.


What are Reversal Chart Patterns?

In order to talk about reversal chart patterns, it needs to be preceded by a trend. The reversal pattern will then signal a reversal of the current trend. We have mentioned that the reversal pattern that occurs on the top of the trend is called a distribution and the reversal pattern that occurs at the bottom of the trend is called an accumulation.

What are the most common reversal chart patterns?

The most common reversal price patterns every trader should know are here: the Head and Shoulders, the Inverse Head and Shoulders, the Double Top, and the Double Bottom.
 

Head and Shoulders pattern

This pattern is one of the most reliable indicators of a trend reversal. The pattern occurs after a previous upward trend and when completed, the market often turns downwards. Sometimes the pattern is called S-H-S (shoulder-head-shoulder).

This pattern is formed by three peaks, the middle of which is the highest one. The middle peak of the pattern is the so-called head, and the two other peaks are the shoulders. In addition, the pattern is formed by a neckline line that connects the lower swings of the pattern (points A and D in Figure 1).

In Figure 1 we have an example of this pattern, from which everything will be clearer.

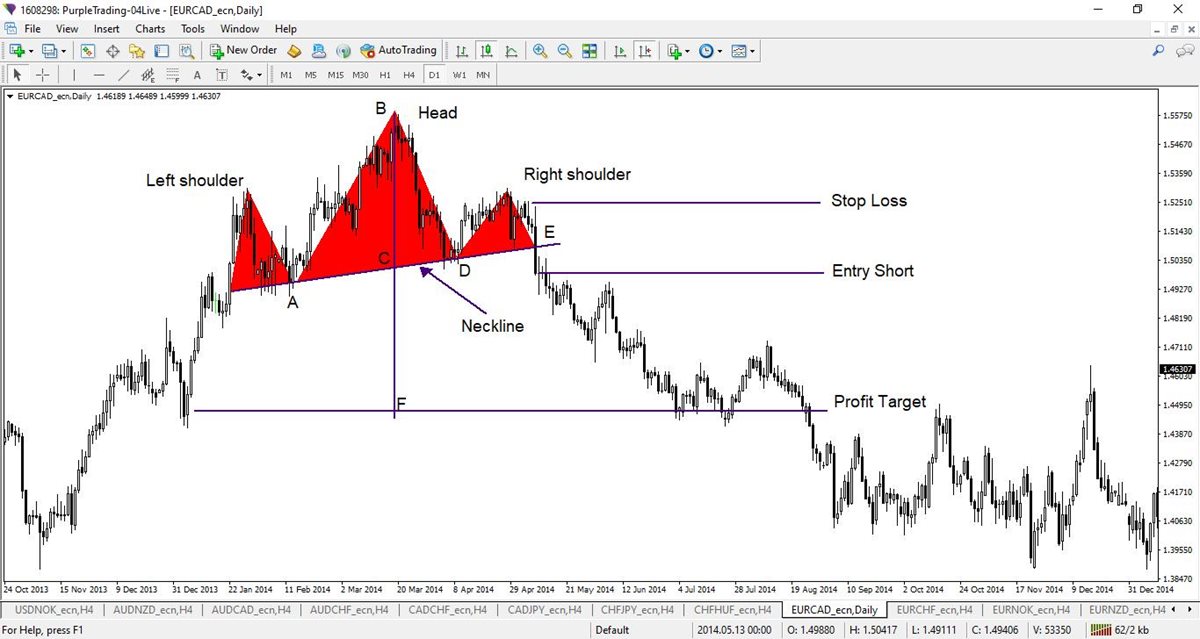
The Head and Shoulders pattern (S-H-S) in the EURCAD currency pair
 

Chart breakdown

A pattern arises so that after the previous uptrend the left shoulder is first created when the price creates a new high and then drops to the point where it previously rose from (point A). In the second phase, the price rises and exceeds the previous peak, resulting in a higher high (point B), and then the price again falls to the central line, the so-called neckline (point D). Then the price rises again, but this time it creates only a lower high, so the uptrend structure is disrupted. The pattern is confirmed when the price crosses the neckline from top to down (see point E).
 

How to trade Head and Shoulders pattern

The pattern is traded by taking the short trade (speculation on price decrease) when the neckline is broken down. To avoid a false break during the day, it is recommended to wait for the daily candlestick to close below the neckline.

The short entry can be either on the price level where the daily candlestick, that broke the neckline, closed. Or the second option is to wait for the price to retest the neckline after its breaking and speculate short on the price drop after that. The second option offers a better Risk Reward Ratio while also confirming the validity of the break.

The stop loss can be either above the right shoulder level or above the last swing before the neckline break through (this option is shown in Figure 1).

To set a target price we have two possibilities:

The first option is to take the target price on the level where the first support level is. The second and more aggressive option is that the target price should be at the same distance as it is the distance from the top of the formation to the neckline. In our case, therefore, the length of the move BC should be equal to the length of the move CF.
 

Few important insights regarding the Head and Shoulders pattern:

  1. For the pattern to be defined as the Head and Shoulders, it must be preceded by a clear uptrend.
  2. No shoulder shall be higher than the top of the head.
  3. The neckline must be either horizontal or ascending. For this formation, the neckline must never be descending. If the neckline is falling it is a signal of the weakness of this pattern.
  4. The tops of the shoulders should be approximately on the same horizontal level.


This pattern occurs in all time frames. We recommend watching it, especially on a daily or weekly chart. The analysis may be supplemented, for example, by moving averages.

Inverse Head and Shoulders pattern

There is also an inverse form of this pattern, which arises after the previous downtrend and it signals that the market is bullish and the trend may reverse soon. This pattern is called the Inverse Head and Shoulders and its example can be seen in this figure:

The Inverse Head and Shoulders in the NZDSGD currency pair
 

The pattern consists of three bottoms, where the first and third bottoms - shoulders are higher than the second bottom, where the head of the pattern is.
 

How to trade Inverse Head and Shoulders pattern:

The same principles apply to trading this pattern as to the Head and Shoulders but in the opposite direction. After breaking the neckline up (point F), we enter the long trade, placing the stop loss either below the low of the third bottom (right shoulder) of the pattern or on the last swing that was before the neckline breakout. The target price is either the closest resistance level or the distance between the highest peak of the pattern and the neckline (in this case, the CB distance is the same as the BF).
 

Few important insights regarding the inverse Head and Shoulders pattern:
 

  1. The pattern must be preceded by a clear downtrend.
  2. No shoulder shall be lower than the top of the head.
  3. The neckline must be either horizontal or descending. In this pattern, the neckline must not be rising.
  4. The tops of the shoulders must be on the same horizontal level.

In reality, there will be some deviations but the closer to the above rules, the more reliable the pattern will be. It is also possible to complement the analysis with other technical analysis tools, such as moving averages for example.

Read the previous articles about Price action

Tops and bottoms price patterns

The tops and bottoms are other important reversal patterns. The Double Top or the Double Bottom patterns are most often mentioned. Besides them, there are patterns Triple top, Triple bottom, etc.
 

Double Top pattern

The Double Top is a very popular pattern used for trend reversal identification. The pattern signals a possible end of the previous rising trend, and as the name suggests, the pattern is formed by two tops, when the first one is formed and if the other peak does not have enough strength to overcome the previous peak, the trend reverses. The pattern resembles the letter M.

In the price chart, this pattern looks like this:

The Double top pattern in the GBPUSD currency pair
 

Chart break down:

We have the GBPUSD currency pair in a weekly timeframe here. First, the top A was created followed by a correction at point B. Later, the second top was formed at point C which is approximately at the same price level as point A. The pattern is confirmed by breaking the signal line which is the lowest price level of the pattern at point B.

It can be seen that at the top C, the price slightly exceeded the previous top A. This is because traders tend to put their stop losses close just behind the previous top. This is then used by big players as they use those orders as liquidity they need.
 

How to trade the Double Top pattern

The pattern Double Top is conservatively traded after breaking the signal line downwards. Therefore, an entry would be at point E. Stop loss is usually above the top of the pattern, and for the target price the distance between the signal line and the top of the pattern should equal the distance between the target price and the signal line. This gives RRR 1:1 which may not be sufficient in some cases. In order to get better RRR the alternative option is to move to stop loss closer to the signal line e.g. above the last swing on the daily chart before a breakout.

More aggressive traders could consider an entry at point D, in the case of bearish candlestick closing below the previous bullish candlestick. It is important to realize that the pattern Double Top is not confirmed at this point yet, it is only a bounce from that resistance line. Because at this moment we do not know if the price breaks through the signal line, we would set the target price to the nearest support level, which is above the mentioned signal line.

Double Bottom pattern

This pattern is the opposite of the Double Top. The Double Bottom forms a downtrend and it suggests that this trend is near the end and bulls could take over the initiative instead of bears.

Figure 4 shows an example of this formation in the SP500 index.

The Double Bottom pattern


Chart break down

First, the first bottom was formed, in a downtrend see point A, and then a correction was created at point B. A few days later the second bottom C formed at the same level as point A. The price level at point B forms a signal line of the pattern.


How to trade the Double Bottom pattern

In a conservative strategy, the pattern is traded after the price breakout of the signal line upwards and the entry would be at point F.

The stop loss is below the lowest point of the pattern and the distance between the signal line and the target price at point G should equal the distance between the signal line and the pattern bottom. Alternatively, we could set a stop loss at point E which is the last swing before the breakout of the signal line.

We have also another possibility of how to trade this pattern. An aggressive entry could be at point D after the daily bullish candlestick closes above the previous candlestick. However, at this moment we do not know if the price reverses as the chart pattern is not confirmed yet. For this reason, it is recommended to target the price to the nearest resistance line, which is a signal line of this pattern.

Join thousands of satisfied clients and trade with the leading European broker in terms of profitability


Your capital is at risk.

Key terms

Accumulation
Show answer
An accumulation is a price formation that occurs at the lower levels of a trend. It is an area where the market moves sideways and active buying occurs. The opposite of accumulation is distribution.
 
Candlestick
Show answer
A graphical representation of the movement of the price change within the selected time frame. For example, a single candle on a daily time frame represents the price movement for one day. One candlestick on an hourly time frame represents the price movement over one hour. One candlestick shows open, close, high and low price within given time frame.
Candlestick patterns
Show answer
Candlestick patterns consist of one or more candles. Most candlestick formations consist of a maximum of five candles. They are used for short-term predictions of price movements or serve as confirmation for trade entry.
Continuous price patterns
Show answer
They are either price or candlestick patterns and they signal the continuation of an existing trend. These formations often occur when the main trend has slowed or formed a short-term pullback, i.e. the price has pulled back a bit. It should be said that formations are considered continuous if they follow the previous trend. Continuous price formations include flag, pennant, triangle and rectangle.
Downtrend
Show answer
The price of an instrument forms a lower high and a lower low over time. It is the basic formation of price action.
Head and Shoulders
Show answer
The head of the shoulder is a price formation that signals a change in trend direction. It is made up of one higher peak and two lower peaks.
Price patterns
Show answer
They are formed by many candles and take longer time to form.
Resistance
Show answer
Border of “resistance” visible in the chart. It forms in the space where bid (supply) is higher than ask (demand) while the price doesn’t jump over this level and keeps bouncing back down off of it.
Reverse price patterns
Show answer
Reverse formations signal a reversal of the current trend. The current trend will stop after some time, a consolidation will occur and then a new trend will start. A reverse formation that forms at the top of a move is called a distribution, where active selling of the instrument occurs. On the other hand, the formation that forms at the lower levels is accumulation, which is the area where active purchases will occur.
Short
Show answer
Short speculation is a trade where the trader anticipates a market decline. So the trader will sell the asset (SELL).
Stop-loss, SL
Show answer
A protective order which enables closing a losing position on a predefined level. After activation it is executed as a MARKET type order.
Support
Show answer
Border of “support” visible in the chart. It forms in the spaces where ask (demand) is higher than bid (supply) while the price doesn’t fall beneath this level and keeps bouncing back up off of it.
Trend line
Show answer
A trend line is a technical analysis tool. It is a straight line formed by connecting at least two points on the price of an instrument. It can be downward or upward. It is used to determine the trend or supports and resistances within the trend.
66.30 % of retail investors lose their capital when trading CFDs with this provider.

CFDs are complex instruments and come with a high risk of losing money rapidly due to leverage. 66.30 % of retail investors lose their capital when trading CFDs with this provider. You should consider whether you understand how CFDs work and whether you can afford to take the high risk of losing your money.