66.30 % of retail investors lose their capital when trading CFDs with this provider.

CFDs are complex instruments and come with a high risk of losing money rapidly due to leverage. 66.30 % of retail investors lose their capital when trading CFDs with this provider. You should consider whether you understand how CFDs work and whether you can afford to take the high risk of losing your money.

What is Fair Value Gap and how to use it in trading?

Published: 14.02.2024

Price action traders love them and smart money traders also can't get enough of them. In fact, there are few price pattern to that price reacts so strongly, offering a good risk/reward ration. So today, let's take a look at how fair value gaps are created, how to recognize them and most importantly - how to trade fair value gaps.


Price and candlestick formations are the building blocks of quality technical analysis and price action. They are relative easy to remember which makes them an ideal help for beginner traders to orient better in charts and plan their trades. The more advanced traders then use patterns to build their advanced trading strategies, such as Smart Money.

Today's article delves into one of the most popular price patterns: the fair value gap. We'll explore what this pattern entails and how to effectively trade it.

What is the Fair Value Gap?

Fair Value Gaps are price jumps caused by imbalanced buying and selling pressures. These gaps are sometimes called Price Value Gaps, or Singles, and you may also encounter the term imbalance. In this article, we will use the term Fair Value Gap (also referred to as FVG).

Fair Value Gap indicates a market situation where the supply of buyers is significantly higher or lower than the demand of sellers. This can cause the price of an instrument to move quickly towards higher supply or lower demand. The Fair Value Gap then shows the point in the chart where this rapid price movement occurred.

FVGs can be seen on charts as large candles that are not completely covered by the wicks of adjacent candles. The FVG formation consists of three candles and there are bullish and bearish FVGs. In simplified terms, we can illustrate them as follows:


Býčí fair value gap
A bullish Fair Value Gap is created when there is a gap between the high of the first candle and the low of the third candle.
Medvědí fair value gap
A bearish Fair Value Gap is created when there is a gap between the low of the first candle and the high of the third candle.


Fair Value Gaps represent a kind of anomaly, an imbalance in the market, a situation where the price has deviated from fair value. And since the market tends to return to fair value, it is possible to take advantage of this fact.
 

Price action traders rely on FVG to:

  • The likelihood that the market will bounce back to fill the FVG before continuing in the direction it was originally heading.

  • Once the FVG is filled, they are counting on the trend to continue in the direction of the covered gap.

Boost your trading knowledge with Purple Academy!

Successful trader never stops learning. That is why we have created the Purple Academy where you can find interesting articles, knowledge-expanding ebooks and detailed trading turorials. So if you are interested, just dive in and start learning! (It’s free).

When does the Fair Value Gap form?

The situation where the market price deviates from the normal value, thus creating a Fair Value Gap, is not accidental. Therefore, below we describe the scenarios in which a FVG can be expected to form.
 

Important events

Major news that causes a sudden change in market sentiment can lead to a FVG. Such news is, for example, an unexpected increase in interest rates. This increase may then trigger a spike in the domestic currency, which will result in an FVG. There are many events that can cause significant market movement. These are not only macroeconomic data, but also political news, such as information about the outbreak of war, geographical events such as earthquakes, etc.
 

The publication of corporate economic results

If a company's results come as a significant surprise, there will be a rapid price movement. This may then be reflected in the price of the stock index of which the company is a part, which may then form the FVG.
 

Large institutional deals

Large institutional trades can also lead to FVGs. For example, if a large hedge fund buys a large number of shares, this can cause a gap in the market. Or if a central bank starts intervening in the market and buying (or selling) domestic currency, etc.

The publication of important news is often used by big traders to manipulate the market. This results in the creation of a gap, which is then quickly filled. How to read the moves of big traders is discussed in our article on Smart Money and trading using order blocks.

Don’t become a liquidity for someone else, use our Purple Strike indicator

Enter the market when the gap is filled. For precise entry, wait for trade confirmation on the lower timeframe. Again, the FVG can be used for confirmation. Or you can use our trend indicator Purple Strike.

How to Trade the Fair Value Gap

Because these gaps represent an imbalance, Fair Value Gaps often fill up. We can use this knowledge to accurately determine the price level where we want to enter a trade.
 

Filling the gap

With this strategy, it is important to determine what the current trend is. This should be determined on a higher time frame, such as weekly, daily, or H4. A healthy uptrend produces a higher high (HH) and higher low (HL), while a downtrend produces a lower high (LH) and lower low (LL).

If the HH breaks in an uptrend or the LL breaks in a downtrend, a break of structure (BOS) is formed and the trend is likely to continue.

If a break of HL occurs in an uptrend to the downside, a change of character (CHOCH) occurs and the chance that the uptrend could reverse and start to decline increases. In a downtrend, the analogy is then reversed, i.e. when a break of the lower high (LH) to the upside increases the chance that the market decline could stop and the market could start to rise. An example is shown in Figure 2.

Sometimes, however, false breaks can also occur. These are then used to lure you into a trap in order to collect liquidity. Read the article about Smart Money and liquidity withdrawal.

Schéma rostoucího a klesajícího trendu
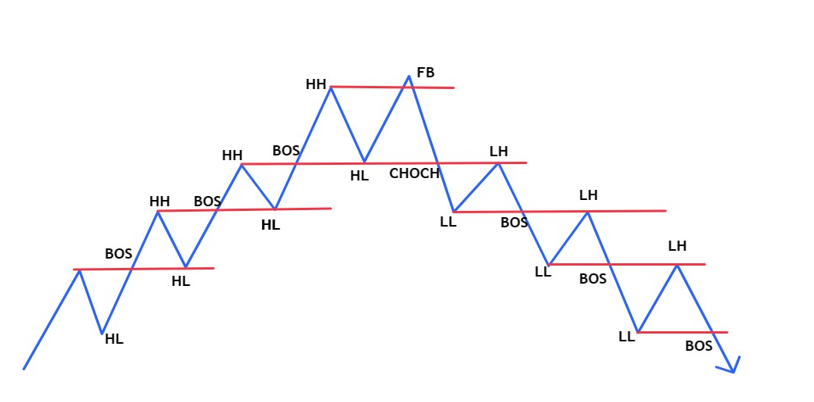
Diagram of increasing and decreasing trend


It is important to note the points where the BOS or CHOCH break occurs. If the break is accompanied by the formation of a FVG, then a strong impulsive move has occurred and the price is likely to continue in the direction of the FVG that formed the break. In such a case, a patient trader will wait for the moment when the broken line is returned (and therefore the gap that was formed on it is filled), and then consider entering in the direction of the filled gap.

If the break occurs such that the break line is not inside the gap, the situation is less reliable for the gap to act as support (uptrend) or resistance (downtrend). An example of a strong break with FVG and a less reliable break without FVG in a bullish trend is shown in the next figure.

Znázornění silného breaku s býčím FVG
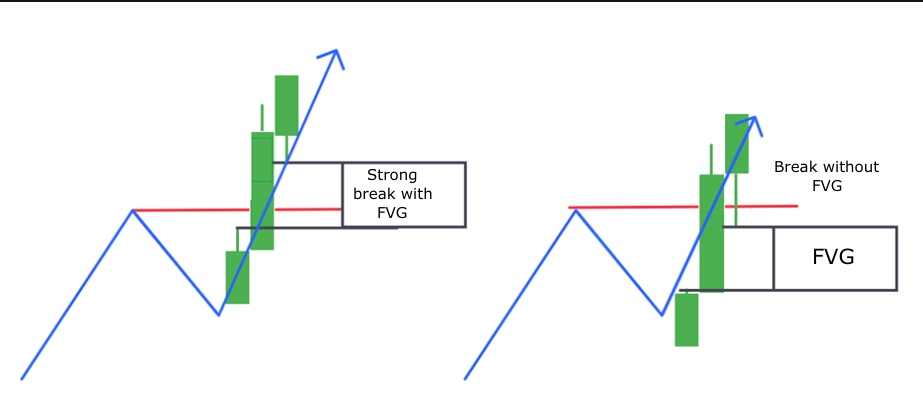
Representation of a strong break with a bullish FVG


In the case of a bearish trend, this is analogous:

Silný break s medvědím FVG
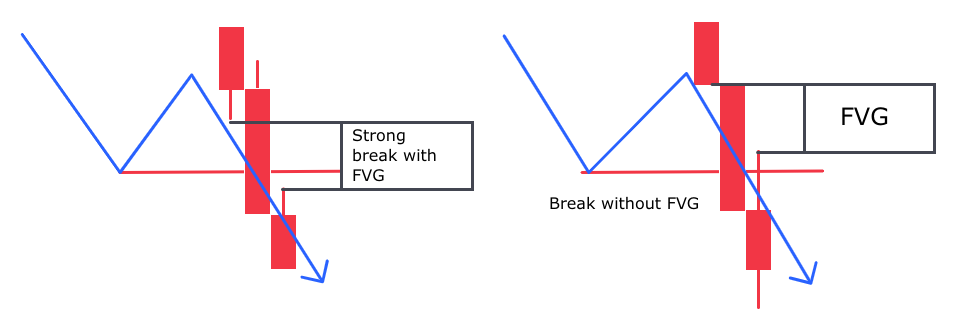
Strong break with bearish FVG
 

The idea is that the break of support or resistance should be inside the FVG, which has a visibly longer middle candle than the surrounding candles. These breaks indicate that they were made with impulsive force and tend to be more reliable. Therefore, it is preferable to focus on these situations.

We will show this practically in the following example, where we have the DJ30 instrument on the H4 chart.

DJI na H4 grafu

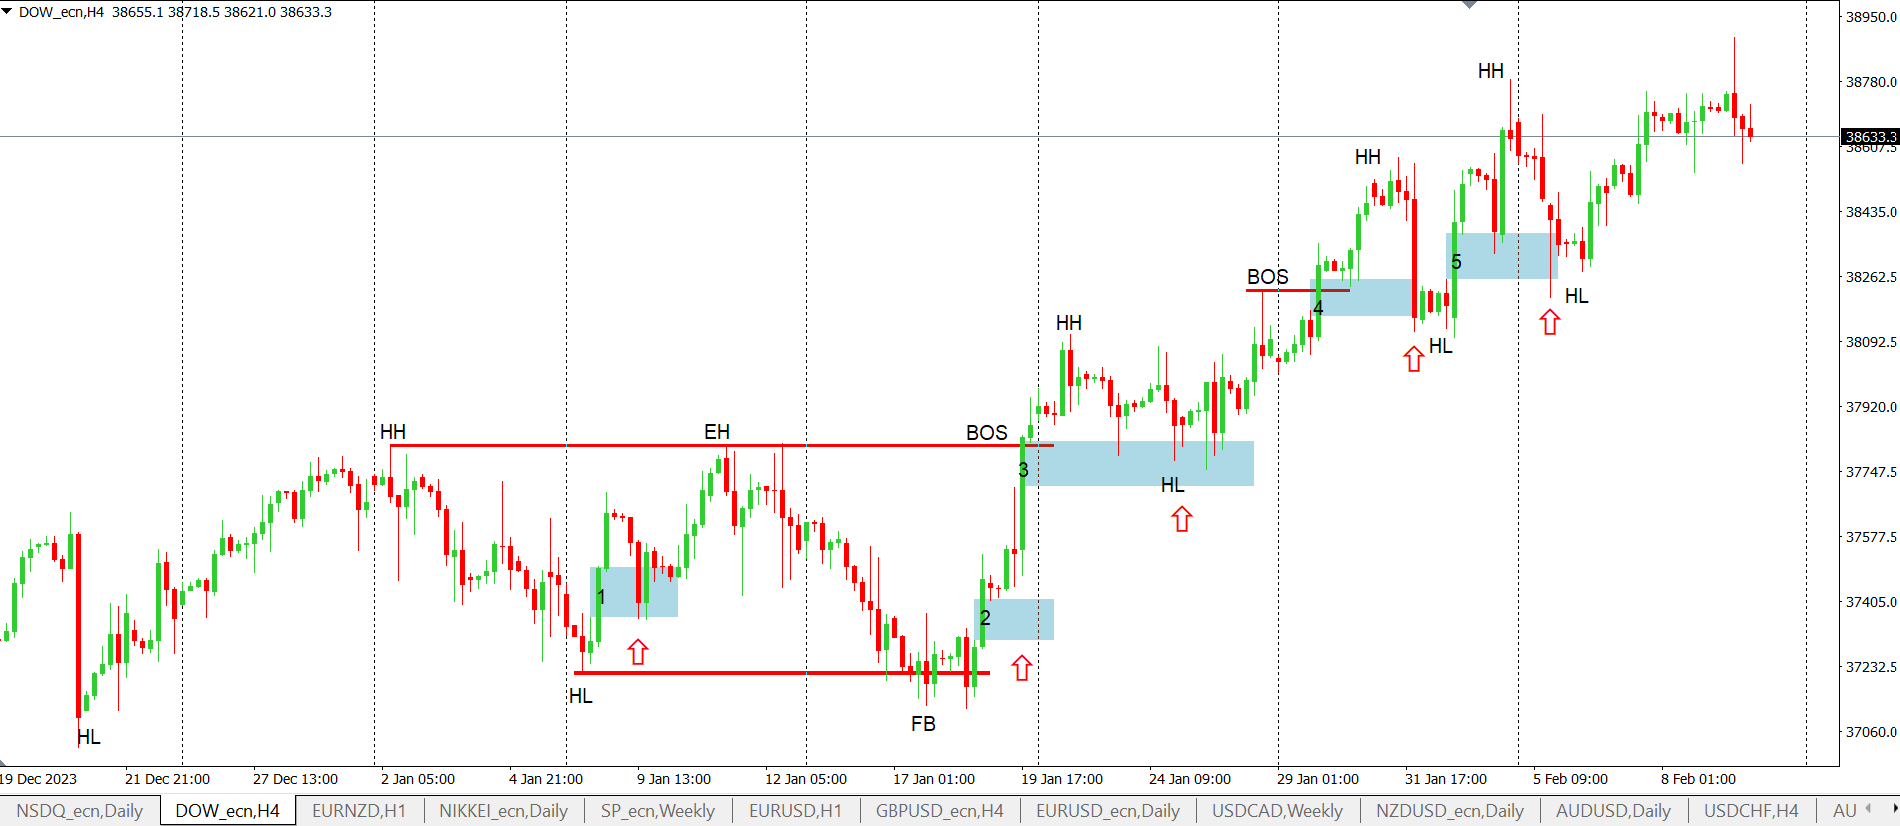
Dow Jones index on H4 chart


We have identified a growing trend in which several FVGs have been formed. In situation 3 and 4, an FVG has been formed with the formation of a BOS structure break in an uptrend. These are situations where it would be possible to enter a long trade in accordance with the previous theory. Then in situations 1, 2 and 5 the FVG was formed inside the uptrend structure.

We can also see that the gap was not always completely filled, so in this case the trade would not have occurred. Gaps 1, 4 and 5 were later filled (see arrow). Then in situation 3 there was a partial filling. In the case of the gap created in point 2, there was no gap filling at all.

You may also notice that when a gap is filled, it may also be 'overshot'. This is because gaps serve as indicators where liquidity is collected in the form of pending stop losses. Liquidity collection theory teaches that smart money will first collect this liquidity and only then will the market turn.

In the next chart we have examples with bullish and bearish FVG, a change in market character (CHOCH) and a BOS with a downtrend.
 

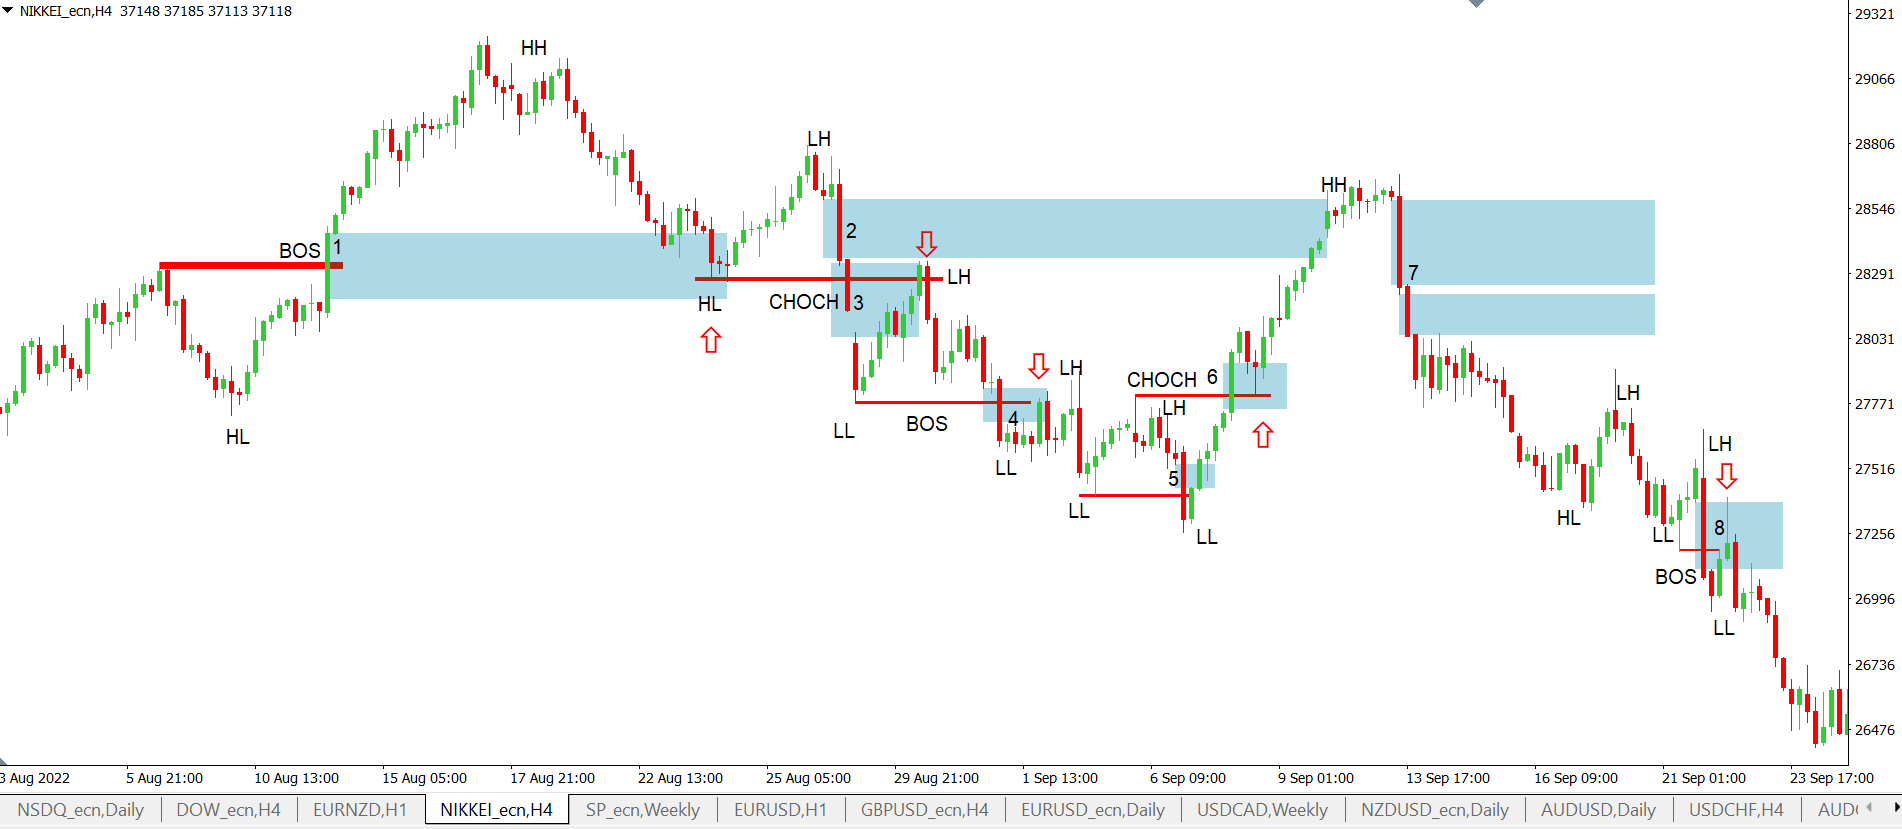
Index NIKKEI na H4 grafu


At FVG 1, the BOS is an uptrend, which was later tested and the price bounced up. At FVG 3, the previous higher low (HL) was broken, so there was a change in market character (CHOCH) which was confirmed by the bearish FVG, which is a strong confirmation. This was later filled and a short could be entered. Candle 4 offered a BOS (break of the lower low, LL) again with an FVG which was later retested and it would be possible to enter short again.

And what about candle 5? This candle did produce an FVG, but this FVG did not break the previous low. The low was indeed broken by a long candle, but the following candle closed above it. So, there was a breakout here, but no FVG (recall Figure 4). Thus, there was no BOS with a valid FVG, but a false break.

Then at point 6, there is again a breakout with a change in market character (CHOCH) as the previous lower high was broken to the upside. It would therefore be a possible long entry. Then the gap from candle 2 was filled and price then reversed down.

The gaps on candle 7 were not filled. Then at 8, the downtrend was confirmed by a lower high and lower low, and since there was a BOS of the lower low with the help of FVG, on retest, a short entry would be valid.

What are the advantages and disadvantages of FVG?

Advantages:

  • If a trader can trade FVG, he can achieve a good risk/reward ratio.

  • FVG can be easily identified in a chart.

  • This strategy can be used on a wide range of assets, including stocks, commodities and currencies.

  • It works on all time frames.


Disadvantages:

  • Sometimes gaps don't fill and sometimes can get "overshot”. This can cause uncertainty.

  • FVGs represent a form of liquidity collected by smart money. Therefore, sometimes the price can go far against the direction of the gap.

More tips for trading with FVG

  • Use a combination of indicators: when trading FVG it can be useful to use a combination of indicators. For example, our Purple Gap indicator is an important tool.
  • Use stop loses: When trading FVG, don't forget to use stop loses. This will help protect your profits and limit your losses.
  • Wait for Confirmation: Before entering a trade, it is important to wait for confirmation that the market will indeed continue in the direction of the gap after the FVG is filled. This can be done by looking for a reversal bullish or bearish candle (such as engulf) on a lower timeframe after the gap is filled, or you can use our Purple Strike indicator.
  • Timing.
  • Liquidity Pick: If the gap is close to an area where liquidity could be picked (for example, FVG is near the previous day's high or low), wait for liquidity to be picked. Only then enter the trade.

A guide to candlestick formations and price patterns

Download this free guide to help you get to grips with the basic types of candlestick formations and price patterns. Always keep it handy to learn the basics of price action and forecasting potential price movements.
66.30 % of retail investors lose their capital when trading CFDs with this provider.

CFDs are complex instruments and come with a high risk of losing money rapidly due to leverage. 66.30 % of retail investors lose their capital when trading CFDs with this provider. You should consider whether you understand how CFDs work and whether you can afford to take the high risk of losing your money.