Overview of performance of ETF portfolios in Purple Trading - Q1 2020
As we pointed out before, none of our ETF portfolios is actively managed and it copies market events only passively. Therefore, its performance mirrors the development of global economies narrowly and therefore, it’s also affected by the impacts of actual virus pandemic.
We have already described the main events on financial markets in a different article, so let’s take a look at how it affected the performance of portfolios.
Mixed portfolios
(Performance charts on March 31, 2020, fees included)
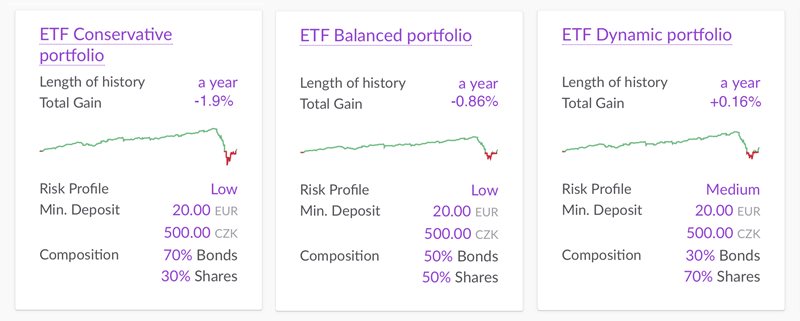
Each of the three stated mixed ETF portfolios contain the same underlying ETF instruments, but the differences between them are only in the allocation of invested client funds between the bond and stock based ETFs. Therefore, charts of each of the three portfolios look alike very much and they vary only in nominal values with deviations between profits and losses.
Each portfolio had a very perspective start of this year and during the first month, the most conservative one saw a 3% profit increase, reaching very nice total profit of +12.22 % in only a single year after its launch. At that time, stock indices rose, exceeding their maximums, while economies showed optimistic statistics as well as our portfolios. And although the indicators from German automotive industry or Purchasing Managers’ Indices were not that optimistic and some analysts saw an incoming crisis in their statistics, nobody expected what eventually happened. When the first information from China came out and coronavirus started to spread in first parts of Europe without control, in particular in the most developed and the richest region of Italy, stock indices reacted with significant drops. The U.S. S&P 500 index needed only 22 days to fall for more than 30% from its record max, thus creating a new historical record. The second, third and fourth major drop of this size was seen during the Great Depression, i.e. in 1934, 1931 and 1929. However, immediately thereafter, at the end of March, strong correction came and it’s hard now to estimate what will be the development during the following weeks or months.
Nevertheless, in Purple Trading, we believe that even if it lasts for months or (in the worst case) even couple of years when the values of indices could drop even more or stagnate, at the end, global economies will recover again and the values of the biggest companies will rise again, plus some new, even bigger and stronger will occur, while respective indices achieve their maximum levels and at the end, they will exceed them.
That means that the actual drops could be a great opportunity to participate in the future growth of these publicly traded companies by purchasing and by holding of their shares.
And this is the base we constructed ETF portfolios on and the reason why we invest in them. We consider actual drops on exchanges from a long-term perspective as “sales” or rather as “shopping discounts” when, in simple words, the price of the underlying assets falls and it’s possible to buy more of them for the same price. And we’re glad that many of our clients see it in the same way.
So, let’s take a look at the statistics.
Performance of mixed ETF portfolios in % on March 31, 2020, incl. fees*:
| |
Bonds / stocks |
2019 |
Q1 2020 |
INCEPTION (4.2.2019)
|
| Conservative |
70 / 30 |
+ 8.95% |
- 9.85% |
- 1.90% |
| Balanced |
50 / 50 |
+ 12.86% |
- 12.04% |
- 0.86% |
| Dynamic |
30 / 70 |
+ 16.73% |
- 14.07% |
+ 0.16% |
* Information stated above is related to the past; however, past development represents no guarantee or reliable indicator for future profits. Please, take into account that your net profit may differ depending on the time you invested your funds, due to the fees related to your portfolio (Management fee and/or Front fee), but also on the basis of potential differences between the performance of EUR, CZK or USD versions of this portfolio.
Purely stock portfolios
(Performance charts on March 31, 2020, fees included)
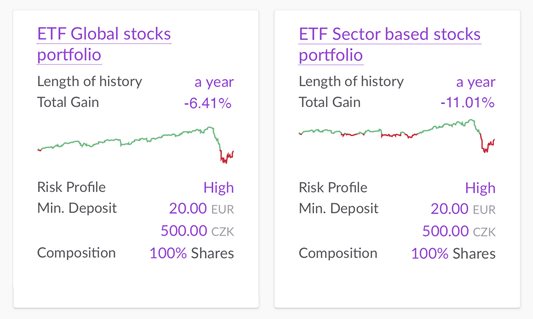
Purely stock ETF portfolios consist of ETF instruments, copying only stock indices, so this is a riskier, but also more interesting category from the potential profits point of view.
So, it’s not a surprise that in case of Global stocks portfolio, its development was similar as in case of portfolios above. Perspective performance of 2019 was even strengthened by the development at the beginning of this year and the profit after 1 year from its inception, and after the deduction of fees, reached to +26.38%. But also here, a deeper drop took place with regard to the events stated before, and thus its resulting performance was seen in negative numbers at the end of the first quarter.
Last portfolio in our offer is the so-called “industry” portfolio, focused on the health-care industry and ageing population. Over the previous quarter, this portfolio saw a similar development as the other ones and it’s not necessary to repeat the same reasons. If you think that in these days this industry should be the one that should benefit thereof and should recover faster, it could be an interesting choice.
Performance of stock ETF portfolios in % on March 31, 2020, incl. fees*:
| |
bonds / stocks |
2019 |
Q1 2020 |
inception (4.2.2019) |
| Global stocks |
0 / 100 |
+ 19.11% |
- 21.21% |
- 6.41% |
| Sector based stocks |
0 / 100 |
+ 7.95% |
- 17.34% |
- 11.01% |
* Information stated above is related to the past; however, past development represents no guarantee or reliable indicator for future profits. Please, take into account that your net profit may differ depending on the time you invested your funds, due to the fees related to your use of portfolio (Management fee and/or Frontentry fee), but also on the basis of potential differences between the performance of EUR, CZK or USD versions of this portfolio.
As always,
you can find the actual performance of all ETF portfolios in your PurpleZone. If you see rather an opportunity in the actual turbulent situation and believe, as we do, that the global economies as well as the shares of the most valued companies will once recover from the actual drops, and you don’t want to analyze and handpick from the hundreds of equities, nor to send your investments into expensive mutual funds or non-performing bank products, don’t hesitate to open an ETF investment account directly in the PurpleZone and try to invest in a diversified and simple way (either regularly or one time), and from EUR 20 already.