66.30 % of retail investors lose their capital when trading CFDs with this provider.

CFDs are complex instruments and come with a high risk of losing money rapidly due to leverage. 66.30 % of retail investors lose their capital when trading CFDs with this provider. You should consider whether you understand how CFDs work and whether you can afford to take the high risk of losing your money.

Understanding the oversold and overbought market

Published: 26.10.2023

When trading in the financial market, we often come across the terms oversold and overbought market. But what do these terms actually mean and how can they help us achieve better results? You will find the answer inside this article.

When we talk about an oversold market, we mean that the price of the asset has fallen too quickly and may be considered "cheap" or "undervalued". In this case, traders can expect that the price is likely to turn around and start rising in the near future.

Conversely, an overbought market indicates that the market is overbought, the price of the asset has risen too quickly and may be considered "expensive" or "overvalued". Traders in this case can expect prices to fall.

In simple terms, when the market is overbought, it means that the asset has been overbought and may be poised to fall. Conversely, when the market is oversold, it means that assets have been sold in excess and may be poised to rise.

Why should you care about oversold and overbought market?

Recognizing these conditions can offer traders significant trading opportunities. If the market identifies an asset as oversold, it may signal a good time to buy. Conversely, when an asset is overbought, it may be a good time to sell.

Oscillators are used to identify when the market is overbought/oversold. However, conventional oscillators that show oversold and overbought conditions can sometimes be inaccurate or delayed in identifying these conditions.

Issues of traditional oscillators

Traditional oscillators such as RSI, Stochastic or MACD have a long history in technical analysis. These tools can often provide valuable signals of oversold and overbought market conditions. However, in some situations they can have their pitfalls.
 

  1. Delay 

    One of the main problems with traditional oscillators is their delay. This means that the signal can come after the market has already started to turn. This delay can mean losing potential profits or entering a trade at an inappropriate time.
     

  2. False signals

    Another problem is the occurrence of false signals. For example, the market may continue to fall even though the oscillator shows that it is oversold. This can lead to inaccurate trading decisions.
     

  3. Excessive sensitivity

    Some oscillators can be overly sensitive to minor price movements, which leads to frequent changes in their values and can cause confusion when interpreting signals.


Therefore, traders often look for more advanced tools that eliminate these problems.

Purple Bands Indicator - Key to identify oversold and overbought

Unlike traditional oscillators, the Purple Bands indicator is designed to more accurately and timely identify oversold and overbought conditions in the market. This indicator is a great tool for detecting oversold or overbought market conditions, with up to 80% accuracy.
 

What are the features of the Purple Strike Indicator?

The Purple Bands Indicator is unique in that it plots new price levels at exactly midnight every trading day, which then remain unchanged throughout the day. Therefore, unlike most other common indicators, the Purple Bands Indicator does not experience any changes in its values throughout the day.

The indicator plots zones of different colors that indicate areas where the market price is already overbought and is likely to start falling, or conversely, where the market price is undervalued and should start rising in the near future. As the colour gets darker, the probability of a trend reversal increases, although very often a reaction occurs in the lightest areas.
 

How does the Purple Strike Indicator work in practice?

Assuming you have successfully installed the indicator, you can start using it on all markets. However, the indicator is ideal for markets where large and long trends are not common - i.e. most currency pairs.

You can display the Purple Bands indicator on any intraday and swing timeframe. It is therefore very flexible and can adapt to your trading style and strategy.
 

Example

In the chart below you can see the currency pair USDJPY on timeframe H1. The Purple Bands indicator shows in two cases (in red circles) that the price is in the lightest area, which indicates that the market is oversold in the first case (from the left) and should start to rise. In the second case, the market is overbought and a short-term decline is expected. However, remember that the indicator does not provide a 100% guarantee and it is always important to respect your trading strategy and money management.
 

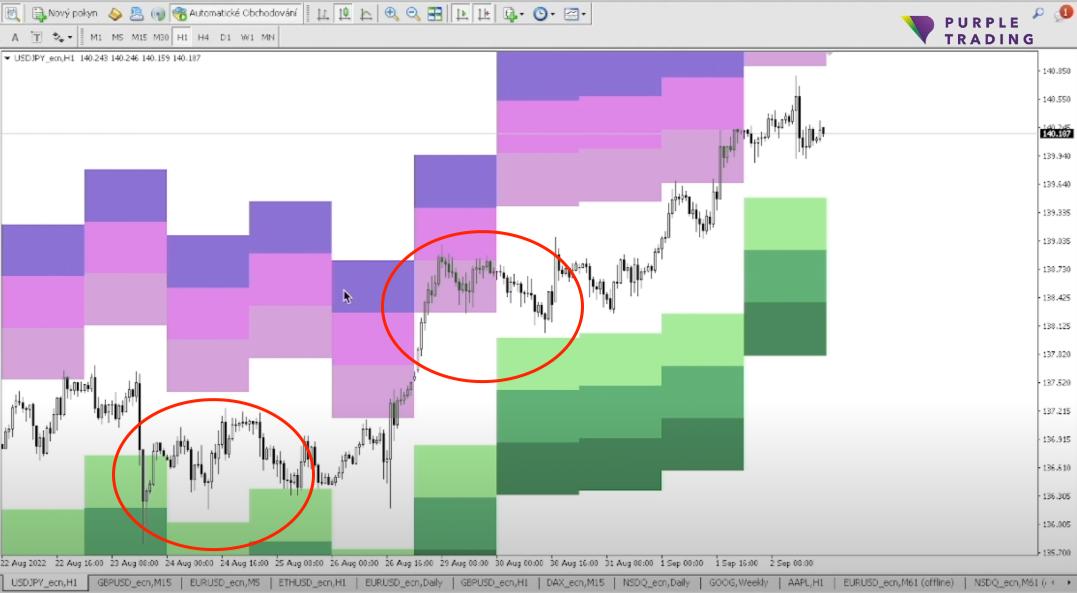
Purple Bands indicator on USDJPY, H1 Timeframe


Purple Bands Indicator is a great tool for identifying potential trading opportunities. Combining it with our other unique tool, the Purple Strike Indicator, can lead to a more powerful and effective trading strategy. With these tools, your trading in the financial markets can be even more successful.


How the Purple Bands Indicator works - watch the video

Try Purple Bands indicator for free on our demo account

Recommended articles

66.30 % of retail investors lose their capital when trading CFDs with this provider.

CFDs are complex instruments and come with a high risk of losing money rapidly due to leverage. 66.30 % of retail investors lose their capital when trading CFDs with this provider. You should consider whether you understand how CFDs work and whether you can afford to take the high risk of losing your money.