Positions of large speculators according to the COT report as at 21/1/2022
Speculators total net positions in the USD index fell by 1,500 contracts last week. This change is the result of a decrease in long positions by 3,500 contracts and a decrease in short positions by 2,000 contracts.
The important news is that large speculators positions in the Canadian dollar have again moved into bullish sentiment. The bullish sentiment is also rising strongly in the euro and the British pound. The speculators total net positions continued to rise in the Australian dollar, the New Zealand dollar and the Japanese yen.
The decline in the speculators total net positions occurred only in the Swiss franc.
The positions of speculators in individual currencies
The total net positions of large speculators are shown in Table 1: If the value is positive then the large speculators are net long. If the value is negative, the large speculators are net short.
|
|
21/1/2021
|
14/1/2022
|
7/1/2022
|
3/1/2022
|
24/12/2021
|
17/12/2021
|
|
USD index
|
36 400
|
37 900
|
39 100
|
36 800
|
35 100
|
31 200
|
|
EUR
|
24 600
|
6 000
|
-1 500
|
-6 600
|
-10 200
|
-11 900
|
|
GBP
|
-200
|
-29 200
|
-39 100
|
-50 700
|
-57 700
|
-50 700
|
|
AUD
|
-88 500
|
-91 500
|
-89 400
|
-81 700
|
-80 400
|
-78 900
|
|
NZD
|
-8 300
|
-8 600
|
-8 800
|
-8 400
|
-6 100
|
-5 900
|
|
CAD
|
7 500
|
-7 400
|
-11 000
|
-10 300
|
-9 900 |
-13 100
|
|
CHF
|
-10 800
|
-7 700
|
-9 600
|
-10 700
|
-9 200
|
-8 300
|
|
JPY
|
-80 900
|
-87 500
|
-62 300
|
-53 100
|
-52 300
|
-53 500
|
Table 1: Total net positions of large speculators
Notes:
- Large speculators are traders who trade large volumes of futures contracts, which, if the set limits are met, must be reported to the Commodity Futures Trading Commission. Typically, this includes traders such as funds or large banks. These traders mostly focus on trading long-term trends and their goal is to make money on speculation with the instrument.
- The total net positions of large speculators are the difference between the number of long contracts and the number of short contracts of large speculators. Positive value shows that large speculators are net long. Negative value shows that large speculators are net short. The data is published every Friday and is delayed because it shows the status on Tuesday of the week.
- The total net positions of large speculators show the sentiment this group has in the market. A positive value of the total net positions of speculators indicates bullish sentiment, a negative value of total net positions indicates bearish sentiment.
- When interpreting charts and values, it is important to follow the overall trend of total net positions. The turning points are also very important, i.e. the moments when the total net positions go from a positive value to a negative one and vice versa. Important are also extreme values of total net positions as they often serve as signals of a trend reversal.
- Sentiment according to the reported positions of large players in futures markets is not immediately reflected in the movement of currency pairs. Therefore, information on sentiment is more likely to be used by traders who take longer trades and are willing to hold their positions for several weeks or even months.
Detailed analysis of selected currencies
Explanations:
- Purple line and histogram in the chart window:
this is information on the total net position of large speculators. This information shows the strength and sentiment of an ongoing trend.
- Information on the positions of so-called hedgers is not shown in the chart, due to the fact that their main goal is not speculation, but hedging. Therefore, this group usually takes the opposite positions than the large speculators. For this reason, the positions of hedgers are inversely correlated with the movement of the price of the underlying asset. However, this inverse correlation shows the ongoing trend less clearly than the position of large speculators.
- We show moving average SMA 100 (blue line) and EMA 50 (orange line) on daily charts.
Charts are made with the use of www.tradingview.com.
The Euro
|
Date
|
Weekly change in open interest
|
Weekly change in total net positions of speculators
|
Weekly change in long positions of speculators
|
Weekly change in short positions of speculators
|
Sentiment
|
|
21.1.2022
|
9 600
|
18 600
|
7 600
|
-11 000
|
Bullish
|
|
14.1.2022
|
4 100
|
7 500
|
5 300
|
-2 200
|
Bullish |
|
7.1.2022
|
4 900
|
5 100
|
500
|
-4 600
|
Weakening bearish
|
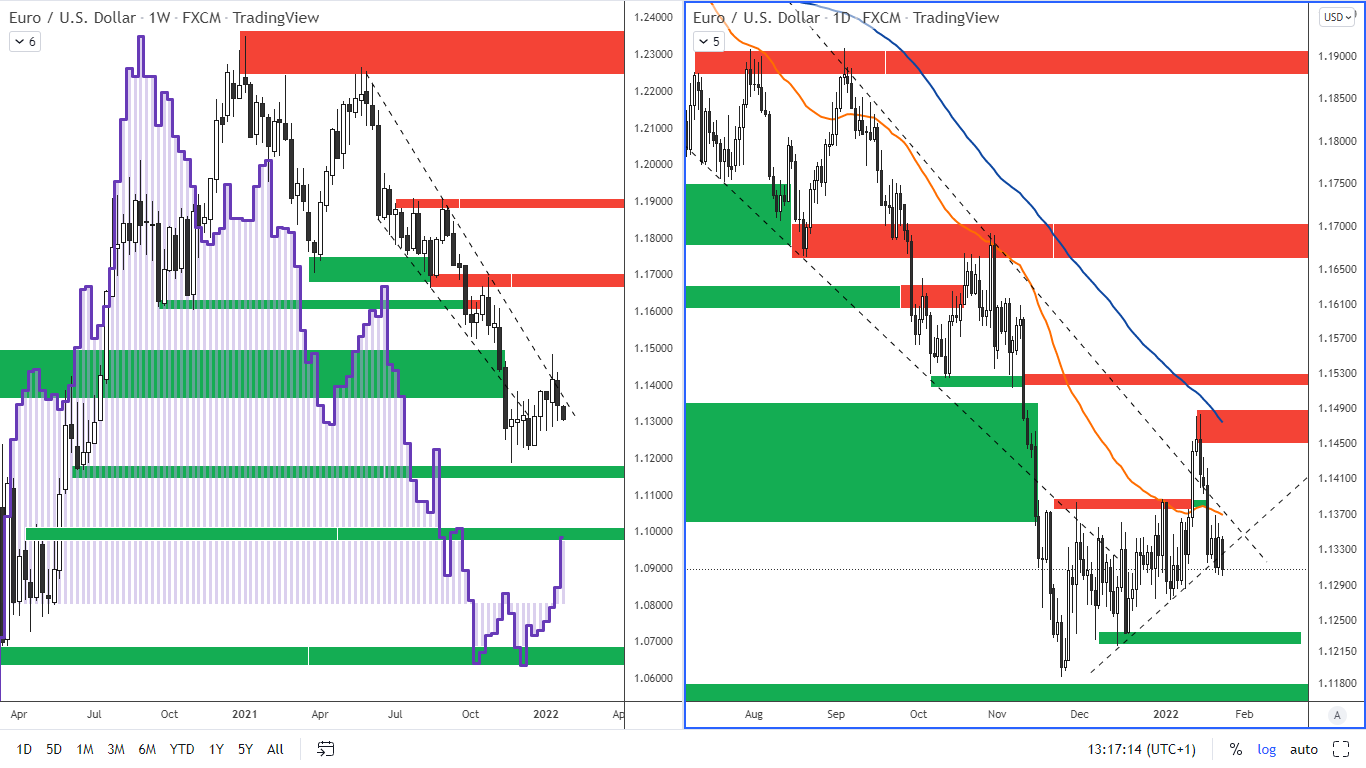
Figure 1: The euro and COT positions of large speculators on a weekly chart and the EURUSD on D1
Speculators total net positions rose by 18,600 contracts last week. This change is due to an increase in long positions by 7,600 contracts and a decrease in short positions by 11,000 contracts.
The euro has bounced back below the downward trend line and is hovering along the support trend line. Breaking through it could cause the euro to weaken to a support at 1.1220
Long-term resistance: 1.1450 - 1.1480
Support: 1.1220 - 1.1230
The British Pound
|
Date
|
Weekly change in open interest
|
Weekly change in total net positions of speculators
|
Weekly change in long positions of speculators
|
Weekly change in short positions of speculators
|
Sentiment
|
|
21.1.2022
|
-17 300
|
29 000
|
9 300
|
-19 700
|
Weakening bearish
|
|
14.1.2022
|
500
|
9 900
|
4 500
|
-5 400
|
Weakening bearish
|
|
7.1.2022
|
-5 371
|
11 600
|
2 900
|
-8 700
|
Weakening bearish
|
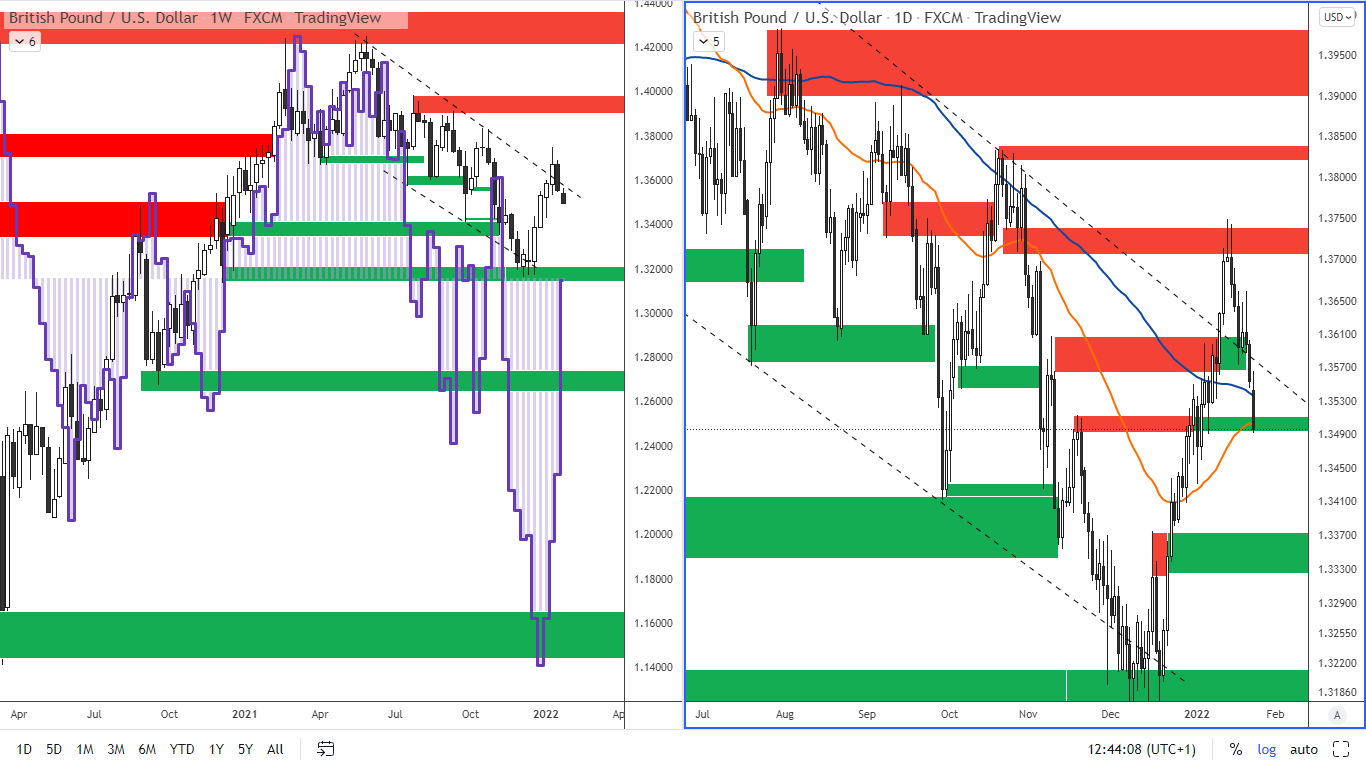
Figure 2: The GBP and COT positions of large speculators on a weekly chart and the GBPUSD on D1
Last week, the total net positions of speculators rose by 29,000 contracts. This stock of total net positions over the past week is the result of a 9,300 increase in long positions and a decrease in short positions of 19,700 contracts.
The pound came to resistance at 1.3700 from where it bounced back to the support at 1.3500. In the event of the break, it is possible to expect a further decrease to the support at 1.3350.
Long-term resistance: 1.3700-1.3750
Long-term support: 1.3490-1.3500
Next support is at: 1.3330 – 1.3370
The Australlian Dollar
|
Date
|
Weekly change in open interest
|
Weekly change in total net positions of speculators
|
Weekly change in long positions of speculators
|
Weekly change in short positions of speculators
|
Sentiment
|
|
21.1.2022
|
-4 300
|
3 000
|
-3 300
|
-6 300
|
Weakening bearish
|
|
14.1.2022
|
5 300
|
-2 100
|
-200
|
1 900
|
Bearish
|
|
7.1.2022
|
- 3 000
|
-7 700
|
- 4 300
|
3 400
|
Bearish
|
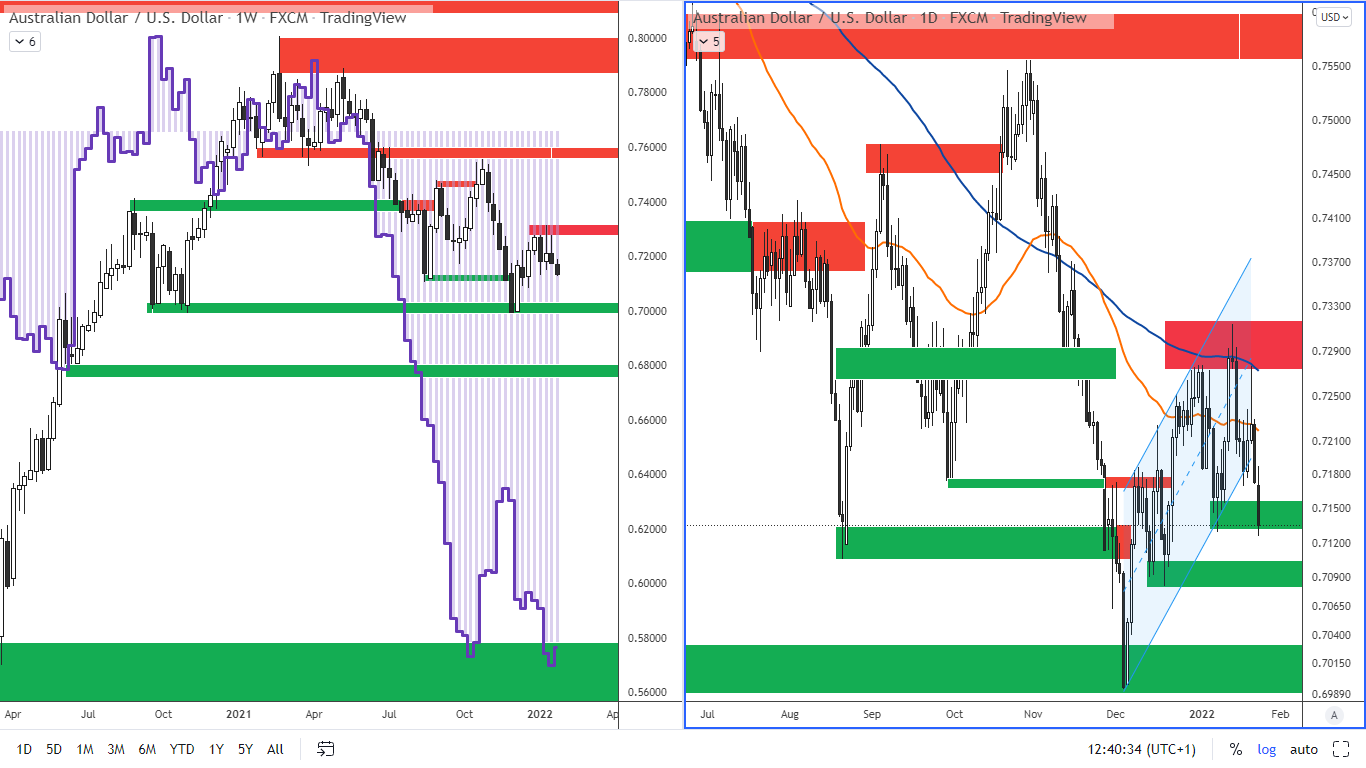
Figure 3: The AUD and COT positions of large speculators on a weekly chart and the AUDUSD on D1
Last week, the total net positions of speculators rose by 3,000 contracts. This change is due to a decrease in long positions by 3,300 contracts and a decrease in short positions by 6,300 contracts.
In the Australian dollar, the price channel was broken last week. The price came to the support at 0.7130. In the event of a break, there may be a decline to the next support at 0.7100. Very significant support is at 0.7000.
Long-term resistance: 0.7290-0.7310
Long-term support: 0.6990-0.7030
The New Zealand Dollar
|
Date
|
Weekly change in open interest
|
Weekly change in total net positions of speculators
|
Weekly change in long positions of speculators
|
Weekly change in short positions of speculators
|
Sentiment
|
|
21.1.2022
|
2 700
|
300
|
700
|
400
|
Weakening bearish
|
|
14.1.2022
|
1 800
|
200
|
1 500
|
1 300
|
Weakening bearish
|
|
7.1.2022
|
-1 600
|
-400
|
-1 800
|
-1 400
|
Bearish
|
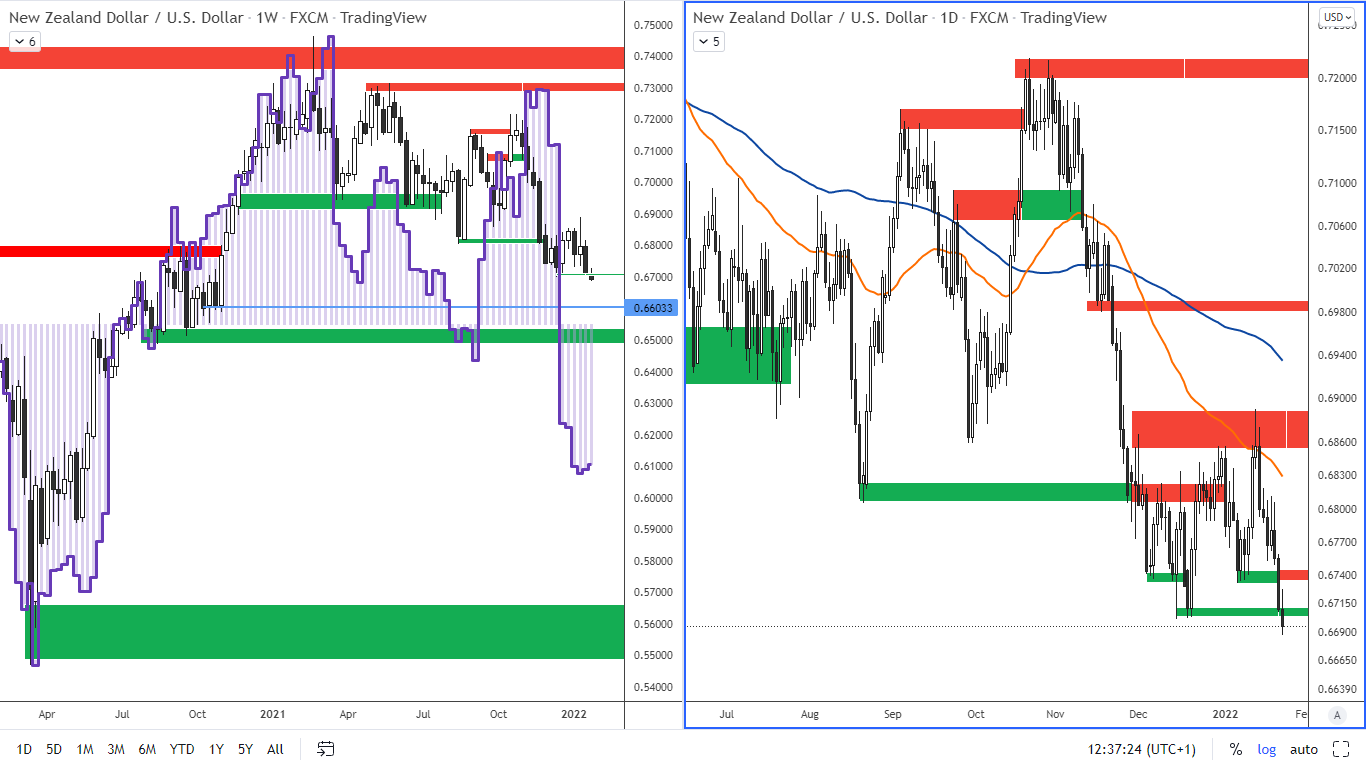
Figure 4: The NZD and the position of large speculators on a weekly chart and the NZDUSD on D1
Last week, the speculators total net positions rose by 300 contracts. The change in total net positions is the result of an increase in long positions by 700 contracts and an increase in short positions by 400 contracts.
The New Zealand dollar tests the support at 0.6700. In the case of a valid break, there is a potential for decline to the next support of 0.6600.
Long-term resistance: 0.6850-0.6890
Long-term support: 0.6590-0.6610