Positions of large speculators according to the COT report as at 14/1/2022
Total net speculator positions in the USD index fell by 1,200 contracts last week. This change is the result of a decrease in long positions by 1,900 contracts and a decrease in short positions by 700 contracts.
The important news is that speculators positions in the euro have turned bullish again. Total net speculators positions also rose in the British pound, the New Zealand dollar, the Canadian dollar and the Swiss franc last week.
Total net positions of large speculators declined last week on the Australian dollar and the Japanese yen.
1. The positions of speculators in individual currencies
The total net positions of large speculators are shown in Table 1: If the value is positive then the large speculators are net long. If the value is negative, the large speculators are net short.
|
|
14/1/2022
|
7/1/2022
|
3/1/2022
|
24/12/2021
|
17/12/2021
|
10/12/2021
|
|
USD index
|
37 900
|
39 100
|
36 800
|
35 100
|
31 200
|
34 900
|
|
EUR
|
6 000
|
-1 500
|
-6 600
|
-10 200
|
-11 900
|
-8 300
|
|
GBP
|
-29 200
|
-39 100
|
-50 700
|
-57 700
|
-50 700
|
-38 300
|
|
AUD
|
-91 500
|
-89 400
|
-81 700
|
-80 400
|
-78 900
|
-81 800
|
|
NZD
|
-8 600
|
-8 800
|
-8 400
|
-6 100
|
-5 900
|
10 700
|
|
CAD
|
-7 400
|
-11 000
|
-10 300
|
-9 900 |
-13 100
|
-9 400
|
|
CHF
|
-7 700
|
-9 600
|
-10 700
|
-9 200
|
-8 300
|
-12 100
|
|
JPY
|
-87 500
|
-62 300
|
-53 100
|
-52 300
|
-53 500
|
-63 100
|
Table 1: Total net positions of large speculators
Notes:
- Large speculators are traders who trade large volumes of futures contracts, which, if the set limits are met, must be reported to the Commodity Futures Trading Commission. Typically, this includes traders such as funds or large banks. These traders mostly focus on trading long-term trends and their goal is to make money on speculation with the instrument.
- The total net positions of large speculators are the difference between the number of long contracts and the number of short contracts of large speculators. Positive value shows that large speculators are net long. Negative value shows that large speculators are net short. The data is published every Friday and is delayed because it shows the status on Tuesday of the week.
- The total net positions of large speculators show the sentiment this group has in the market. A positive value of the total net positions of speculators indicates bullish sentiment, a negative value of total net positions indicates bearish sentiment.
- When interpreting charts and values, it is important to follow the overall trend of total net positions. The turning points are also very important, i.e. the moments when the total net positions go from a positive value to a negative one and vice versa. Important are also extreme values of total net positions as they often serve as signals of a trend reversal.
- Sentiment according to the reported positions of large players in futures markets is not immediately reflected in the movement of currency pairs. Therefore, information on sentiment is more likely to be used by traders who take longer trades and are willing to hold their positions for several weeks or even months.
Detailed analysis of selected currencies
Explanations:
- Purple line and histogram in the chart window:
this is information on the total net position of large speculators. This information shows the strength and sentiment of an ongoing trend.
- Information on the positions of so-called hedgers is not shown in the chart, due to the fact that their main goal is not speculation, but hedging. Therefore, this group usually takes the opposite positions than the large speculators. For this reason, the positions of hedgers are inversely correlated with the movement of the price of the underlying asset. However, this inverse correlation shows the ongoing trend less clearly than the position of large speculators.
- We show moving average SMA 100 (blue line) and EMA 50 (orange line) on daily charts.
Charts are made with the use of www.tradingview.com.
Euro
|
Date
|
Weekly change in open interest
|
Weekly change in total net positions of speculators
|
Weekly change in long positions of speculators
|
Weekly change in short positions of speculators
|
Sentiment
|
|
14.1.2022
|
4 100
|
7 500
|
5 300
|
-2 200
|
Bullish |
|
7.1.2022
|
4 900
|
5 100
|
500
|
-4 600
|
Weakening bearish
|
|
3.1.2022
|
1 000
|
3 600
|
2 000
|
-1 600
|
Weakening bearish
|
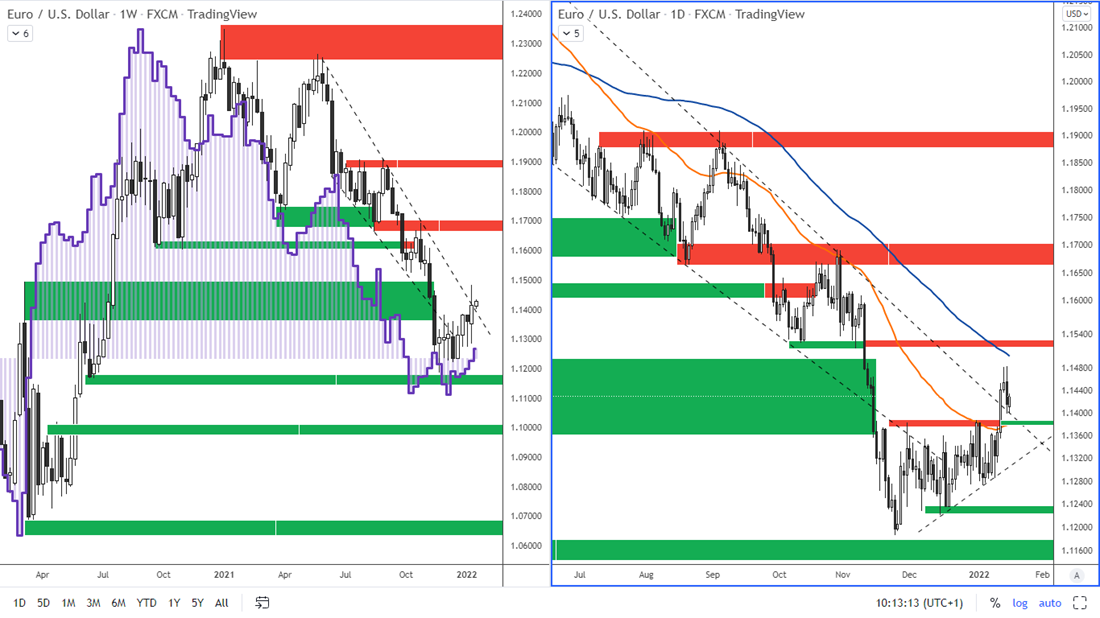
Figure 1: The euro and COT positions of large speculators on a weekly chart and the EURUSD on D1
Total net speculator positions rose by 7,500 contracts last week. This change is due to an increase in long positions by 5,300 contracts and a decrease in short positions by 2,200 contracts.
Speculators' positions in the euro were in bullish territory between March 2020 and September 2021, with the price of the euro reaching as high as 1.2350 before falling down. In October, speculators' total net positions fell into bearish territory and the euro was moving in a downtrend, reaching a low of around 1.12 on November 24. Since then, the euro has climbed back above 1.14 and speculators' positions have swung back into bullish territory.
The euro broke through resistance at 1.1380 and also broke above the upper trend line last week. Speculator sentiment is bullish, so it looks like the euro could strengthen to the next resistance around 1.15.
Long-term resistance: 1.1500 - 1.1530
Support: 1.1370 - 1.1380
Next support: 1.1220 -1.1230
The British Pound
|
Date
|
Weekly change in open interest
|
Weekly change in total net positions of speculators
|
Weekly change in long positions of speculators
|
Weekly change in short positions of speculators
|
Sentiment
|
|
14.1.2022
|
500
|
9 900
|
4 500
|
-5 400
|
Weakening bearish
|
|
7.1.2022
|
-5 371
|
11 600
|
2 900
|
-8 700
|
Weakening bearish
|
|
3.1.2022
|
- 2 400
|
7 000
|
2 300
|
-4 700
|
Weakening bearish
|
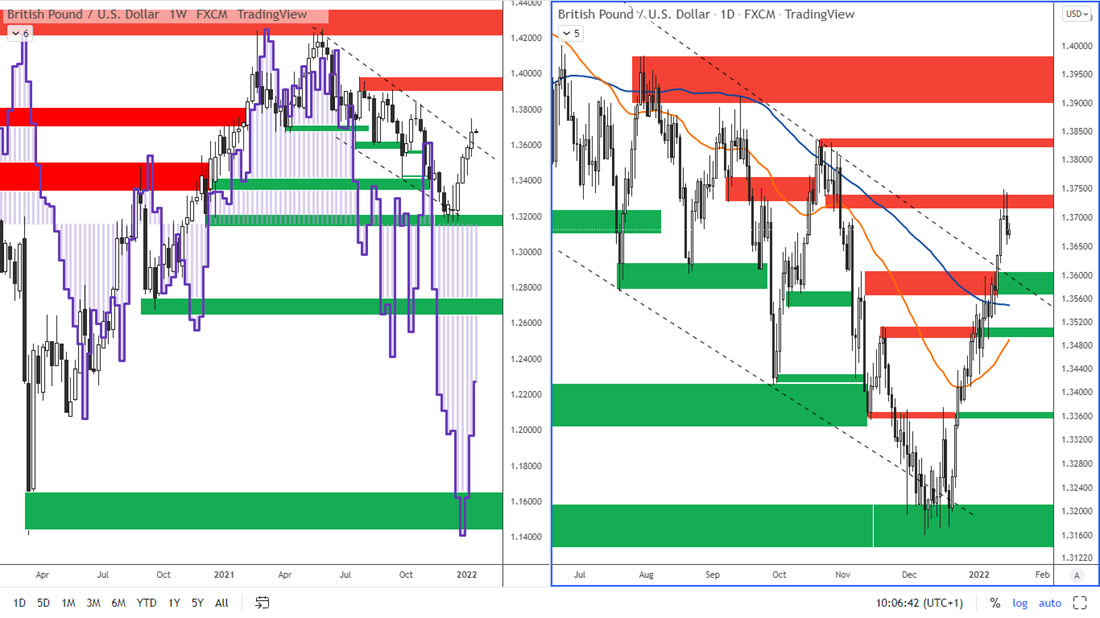
Figure 2: The GBP and COT positions of large speculators on a weekly chart and the GBPUSD on D1
Last week, the total net positions of speculators rose by 9,900 contracts. This increase in total net positions over the past week is the result of a 4,500 contract increase in long positions and a 5,400 contract decrease in short positions.
The pound has reached resistance around 1.3700 - 1.3750
Long-term resistance: 1.3700-1.3750
Long-term support: 1.3570-1.3600
Next support is at: 1.3490 – 1.3510
The Australlian Dollar
|
Date
|
Weekly change in open interest
|
Weekly change in total net positions of speculators
|
Weekly change in long positions of speculators
|
Weekly change in short positions of speculators
|
Sentiment
|
|
14.1.2022
|
5 300
|
-2 100
|
-200
|
1 900
|
Bearish
|
|
7.1.2022
|
- 3 000
|
-7 700
|
- 4 300
|
3 400
|
Bearish
|
|
3.1.2022
|
- 8 200
|
- 1 300
|
-6 100
|
-4 800
|
Bearish
|
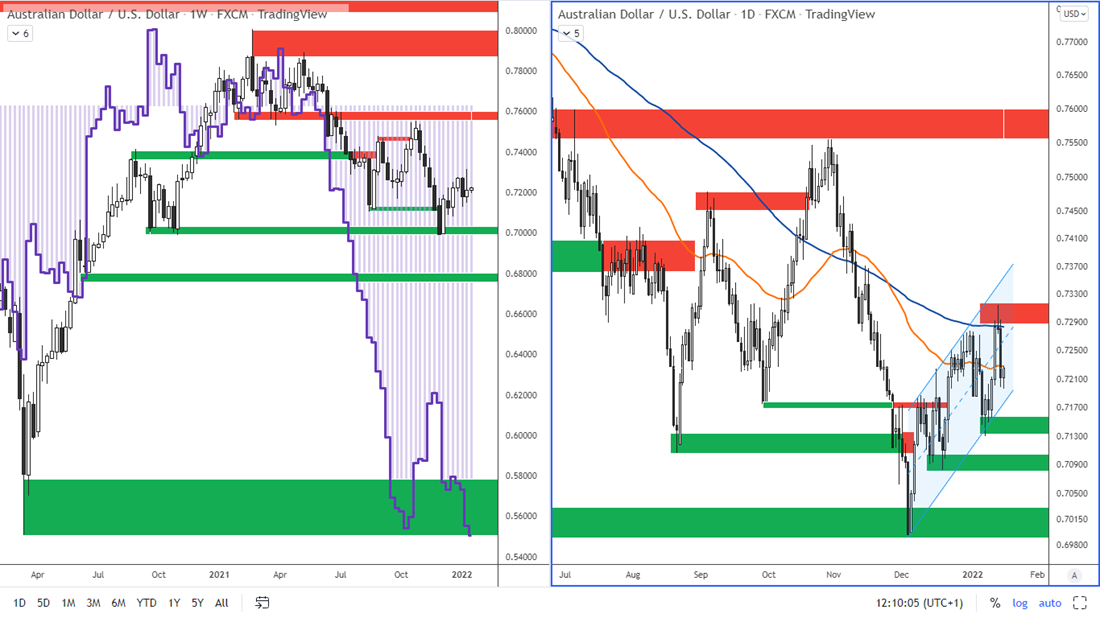
Figure 3: The AUD and COT positions of large speculators on a weekly chart and the AUDUSD on D1
Last week, the total net positions of speculators fell by 2,100 contracts. This change is due to a decrease in long positions by 200 contracts and an increase in short positions by 1,900 contracts.
In the Australian dollar, the price stopped at the SMA 100 moving average on the daily chart last week, where the resistance 0.7290 is. Currently, the AUDUSD is moving in a rising channel that defines supports and resistances.
Long-term resistance: 0.7290-0.7310
Long-term support: 0.7130-0.7150
The New Zealand Dollar
|
Date
|
Weekly change in open interest
|
Weekly change in total net positions of speculators
|
Weekly change in long positions of speculators
|
Weekly change in short positions of speculators
|
Sentiment
|
|
14.1.2022
|
1 800
|
200
|
1 500
|
1 300
|
Weakening bearish
|
|
7.1.2022
|
-1 600
|
-400
|
-1 800
|
-1 400
|
Bearish
|
|
3.1.2022
|
500
|
-2 300
|
200
|
2 500
|
Bearish
|
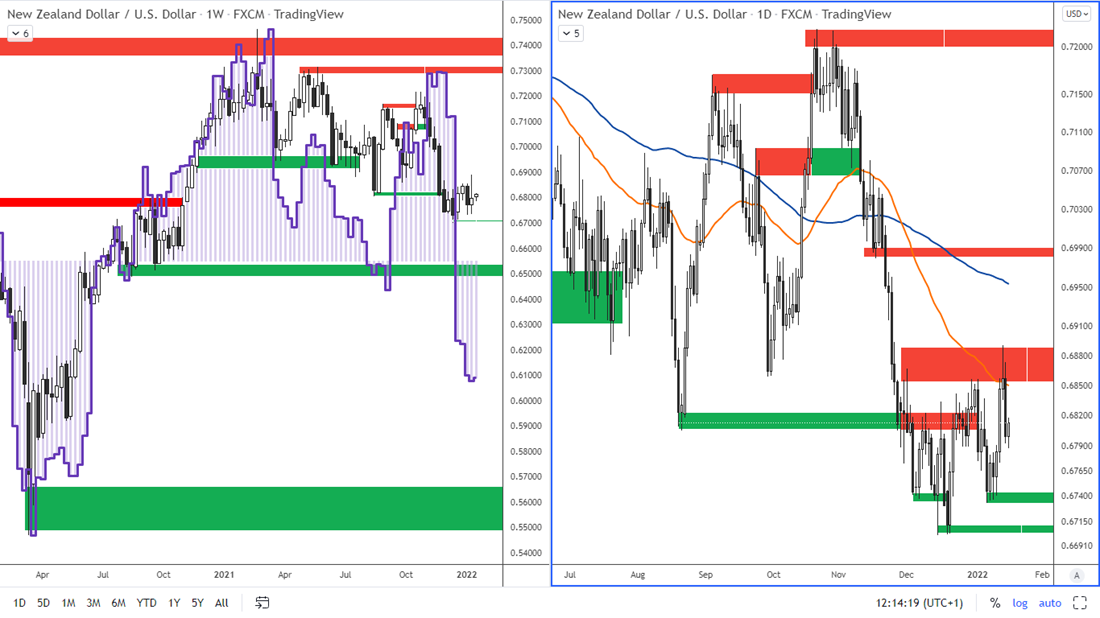
Figure 4: The NZD and the position of large speculators on a weekly chart and the NZDUSD on D1
Last week, total net positions of large speculators rose by 200 contracts. The change in total net positions is the result of an increase in long positions by 1,500 contracts and an increase in short positions by 1,300 contracts.
The New Zealand dollar retested resistance at 0.6850 last week.
Long-term resistance: 0.6850-0.6890
Long-term support: 0.6730-0.6750